启用 GPU 监控仪表板#
GPU Operator 通过使用 NVIDIA DCGM Exporter 为 Prometheus 公开 GPU 遥测数据。这些指标可以使用基于 Grafana 的监控仪表板进行可视化。
执行以下步骤将仪表板添加到 OpenShift Container Platform Web 控制台的“观察”部分。
前提条件#
您的集群使用 OpenShift Container Platform 4.10 或更高版本。
您作为具有
cluster-admin集群角色的用户访问集群。
配置 NVIDIA DCGM Exporter 仪表板#
从 GitHub 上的 DCGM Exporter 存储库下载最新的 NVIDIA DCGM Exporter 仪表板
$ curl -LfO https://github.com/NVIDIA/dcgm-exporter/raw/main/grafana/dcgm-exporter-dashboard.json在
openshift-config-managed命名空间中,从下载的文件创建 ConfigMap$ oc create configmap nvidia-dcgm-exporter-dashboard -n openshift-config-managed --from-file=dcgm-exporter-dashboard.json
标记 ConfigMap 以在 Web 控制台的“管理员”透视图中公开仪表板
$ oc label configmap nvidia-dcgm-exporter-dashboard -n openshift-config-managed "console.openshift.io/dashboard=true"
可选:标记 ConfigMap 以在 Web 控制台的“开发者”透视图中公开仪表板
$ oc label configmap nvidia-dcgm-exporter-dashboard -n openshift-config-managed "console.openshift.io/odc-dashboard=true"
查看已创建的资源并验证标签
$ oc -n openshift-config-managed get cm nvidia-dcgm-exporter-dashboard --show-labels
查看 GPU 指标#
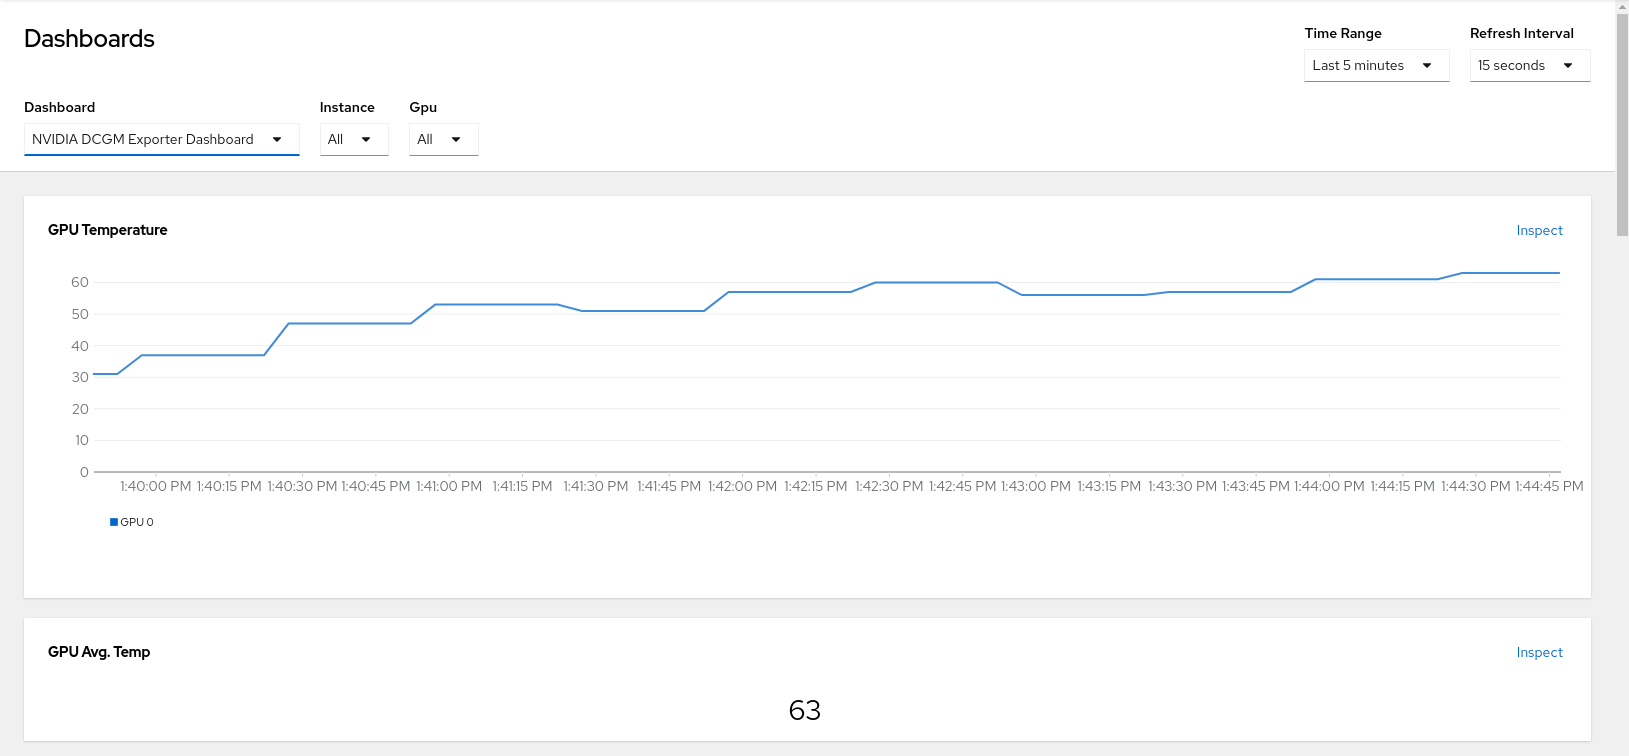
在 OpenShift Container Platform Web 控制台中,从侧边菜单切换到“管理员”透视图,然后导航到“观察”>“仪表板”,并从“仪表板”列表中选择“NVIDIA DCGM Exporter Dashboard”。
如果仪表板已添加到“开发者”透视图,则在 OpenShift Container Platform Web 控制台中,从侧边菜单切换到“开发者”透视图,导航到“观察”>“仪表板”,并从“仪表板”列表中选择“NVIDIA DCGM Exporter Dashboard”。
NVIDIA DCGM Exporter 仪表板显示与 GPU 相关的图表。
提供的 Grafana 仪表板包含一组默认的 DCGM 指标。您可以创建和部署 Grafana 6.x 格式的自定义仪表板定义。
默认 NVIDIA DCGM Exporter 图表#
下表简要描述了默认仪表板上的图表。
图表 |
描述 |
|---|---|
GPU 温度 |
GPU 温度,单位为摄氏度。 |
GPU 平均温度 |
平均 GPU 温度,单位为摄氏度。 |
GPU 功耗 |
每个 GPU 的功耗,单位为瓦特。 |
GPU 总功耗 |
总功耗,单位为瓦特。 |
GPU SM 时钟频率 |
SM 时钟频率,单位为赫兹。 |
GPU 利用率 |
GPU 利用率,百分比。 |
GPU 帧缓冲区已用内存 |
帧缓冲区已用内存,单位为 MB。 |
张量核心利用率 |
张量 (HMMA) 管道处于活动状态的周期比率,百分比。 |