ASIC 监控
Cumulus Linux 提供了多种 ASIC 监控工具,用于收集和分发有关 ASIC 状态的数据。
- 直方图收集
- 接口数据包和缓冲区统计信息 (BETA)
- 高频遥测
启用 ASIC 监控
要为直方图收集和高频遥测启用 ASIC 监控,请运行以下命令。
cumulus@switch:~$ nv set system telemetry enable on
cumulus@switch:~$ nv config apply
asic-monitor 服务管理直方图收集和高频遥测。systemd 管理 asic-monitor 服务。
asic-monitor 服务读取
/etc/cumulus/datapath/monitor.conf配置文件,以确定要收集哪些统计信息以及何时触发。该服务始终启动;但是,如果配置文件为空,则该服务退出。/etc/cumulus/telemetry/hft/hft_job.conf和/etc/cumulus/telemetry/hft/hft.conf文件用于高频遥测。
重启 asic-monitor 服务不会中断流量,也不需要您重启 switchd。
直方图收集
直方图收集监控工具以特定间隔轮询数据并执行某些操作,以便您可以识别和响应问题,例如
- 导致数据包延迟时间更长的微突发。
- 可能导致数据包丢失的数据包缓冲区拥塞。
- 特定交换机、端口或流量类别的网络问题。
Cumulus Linux 提供多个直方图
- 出口队列长度 显示有关出口缓冲区随时间推移利用率的信息。
- 入口队列长度 显示有关入口缓冲区随时间推移利用率的信息。
- 计数器 显示有关端口带宽随时间推移利用率的信息。
- 延迟 显示有关数据包延迟时间随时间推移的信息。
- 因错误导致的数据包丢失(仅限 Linux)。
Cumulus Linux 支持
- Spectrum 1 及更高版本上的出口队列长度直方图。
- Spectrum-2 及更高版本上的入口队列长度直方图和延迟直方图。
- Spectrum-2 及更高版本上的计数器直方图(已传输数据包、已传输字节、已接收数据包、已接收字节和 CRC 计数器)。
- 仅 Spectrum-4 上的计数器直方图(第 1 层已接收字节计数器和第 1 层已传输字节计数器)。
直方图收集示例
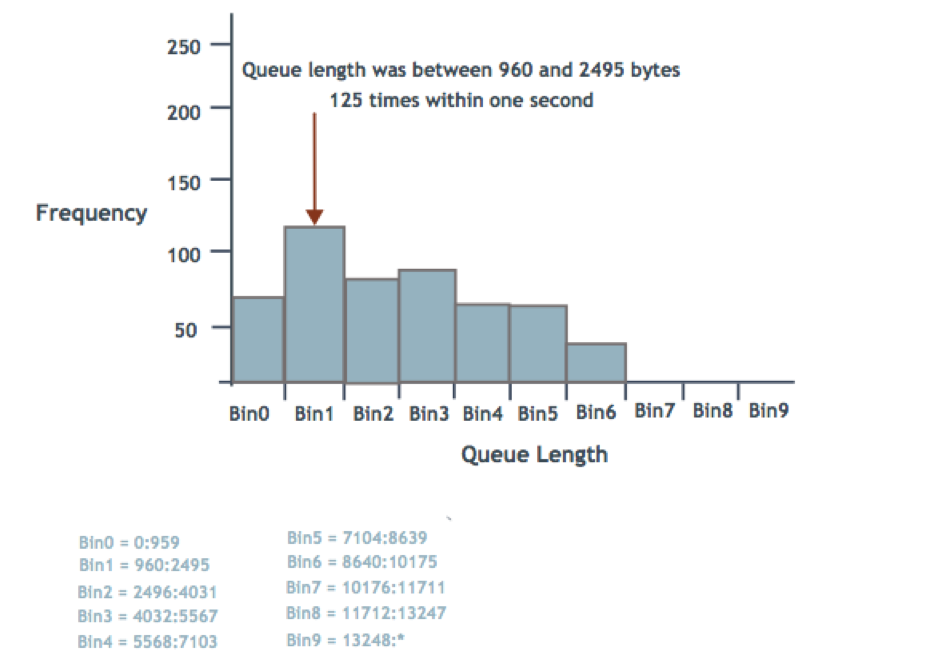
NVIDIA Spectrum ASIC 提供了一种机制,用于测量和报告直方图中的入口和出口队列长度、计数器和延迟(数据的图形表示,将其划分为间隔或箱)。每个队列通过一个包含 10 个箱的直方图报告,其中每个箱代表一个队列长度范围。
您可以使用最小尺寸边界 (Min) 和直方图尺寸配置直方图。然后,您可以通过将最小尺寸边界和直方图尺寸相加来得出最大尺寸边界 (Max)。
10 个箱的编号为 0 到 9。箱 0 代表队列长度,最高可达指定的最小值,包括队列长度 0。箱 9 代表队列长度,最大值及以上。箱 1 到 8 代表最小值和最大值之间相等大小的范围(通过将直方图尺寸除以 8)。
例如,考虑以下直方图队列长度范围,以字节为单位
- 最小值 = 960
- 直方图尺寸 = 12288
- 最大值 = 13248
- 范围大小 = 1536
- 箱 0:0:959
- 箱 1:960:2495
- 箱 2:2496:4031
- 箱 3:4032:5567
- 箱 4:5568:7103
- 箱 5:7104:8639
- 箱 6:8640:10175
- 箱 7:10176:11711
- 箱 8:11712:13247
- 箱 9:13248:*
下图演示了一个直方图,显示了端口的队列长度在每个箱指定的范围内出现的次数。该示例显示,在一个秒内,队列长度在 960 到 2495 字节之间出现了 125 次。
配置直方图收集
要配置直方图收集,您需要指定
- 要收集的数据类型。
- 要监控的交换机端口。
- 对于出口队列长度和延迟直方图,您可以指定要为端口或端口范围监控的流量类别。
- 对于入口队列长度直方图,您可以指定要为端口或端口范围监控的优先级组。
- 如何以及何时开始读取 ASIC:在特定队列长度、接收或传输的数据包或字节数或纳秒延迟时。
- 要采取的操作:创建快照文件、向
/var/log/syslog文件发送消息,或两者兼而有之。
直方图设置
直方图设置包括您要收集的数据类型、您希望直方图监控的端口、直方图的采样时间、直方图尺寸以及直方图的最小边界尺寸。
- 入口队列长度直方图可以监控端口或端口范围的特定优先级组。
- 出口队列长度直方图和延迟直方图可以监控端口或端口范围的特定流量类别。流量类别 0 到 7 用于单播流量,流量类别 8 到 15 用于多播流量。
- 计数器直方图可以监控以下计数器类型
- 您可以为每个物理接口启用最多两种计数器直方图计数器类型。计数器直方图不支持绑定或虚拟接口。
- 默认最小边界尺寸为 960 字节。将此数字添加到直方图的尺寸会产生最大边界尺寸。这些值表示每个箱的队列长度范围。
- 采样时间的默认值为 1024 纳秒。
当您配置最小边界和直方图尺寸时,Cumulus Linux 会将配置的字节值向下舍入到最接近的交换机 ASIC 单元大小的倍数,然后再将其编程到硬件中。单元大小是每个交换 ASIC 上的固定字节数
- Spectrum-1:96 字节
- Spectrum-2 和 Spectrum-3:144 字节
- Spectrum-4:192 字节
直方图类型可以是 egress-buffer、ingress-buffer、counter 或 latency。
- 要更改全局直方图设置,请运行
nv set system telemetry histogram <type>命令。 - 要在接口上启用直方图或更改接口级别设置,请运行
nv set interface <interface> telemetry histogram <type>命令。
以下示例配置出口队列长度直方图,并将最小边界尺寸设置为 960,直方图尺寸设置为 12288,采样间隔设置为 1024。这些设置适用于已启用 egress-buffer 直方图的接口,并且在接口级别没有为这些设置配置不同的值
cumulus@switch:~$ nv set system telemetry histogram egress-buffer bin-min-boundary 960
cumulus@switch:~$ nv set system telemetry histogram egress-buffer histogram-size 12288
cumulus@switch:~$ nv set system telemetry histogram egress-buffer sample-interval 1024
cumulus@switch:~$ nv config apply
以下示例为 swp1 到 swp8 上的流量类别 0 启用出口队列长度直方图,并使用全局应用的最小边界、直方图尺寸和采样间隔。该示例还为 swp9 到 swp16 上的流量类别 1 启用出口队列长度直方图,并将最小边界设置为 768 字节,直方图尺寸设置为 9600 字节,采样间隔设置为 2048 纳秒。
cumulus@switch:~$ nv set system telemetry enable on
cumulus@switch:~$ nv set interface swp1-8 telemetry histogram egress-buffer traffic-class 0
cumulus@switch:~$ nv set interface swp9-16 telemetry histogram egress-buffer traffic-class 1 bin-min-boundary 768
cumulus@switch:~$ nv set interface swp9-16 telemetry histogram egress-buffer traffic-class 1 histogram-size 9600
cumulus@switch:~$ nv set interface swp9-16 telemetry histogram egress-buffer traffic-class 1 sample-interval 2048
cumulus@switch:~$ nv config apply
以下示例配置入口队列长度直方图,并将最小边界尺寸设置为 960 字节,直方图尺寸设置为 12288 字节,采样间隔设置为 1024 纳秒。这些设置适用于已启用 ingress-buffer 直方图的接口,并且在接口级别没有为这些设置配置不同的值
cumulus@switch:~$ nv set system telemetry enable on
cumulus@switch:~$ nv set system telemetry histogram ingress-buffer bin-min-boundary 960
cumulus@switch:~$ nv set system telemetry histogram ingress-buffer histogram-size 12288
cumulus@switch:~$ nv set system telemetry histogram ingress-buffer sample-interval 1024
cumulus@switch:~$ nv config apply
以下示例为 swp1 到 swp8 上的优先级组 0 启用入口队列长度直方图,并使用全局应用的最小边界、直方图尺寸和采样间隔。该示例还为 swp9 到 swp16 上的优先级组 1 启用入口队列长度直方图,并将最小边界设置为 768 字节,直方图尺寸设置为 9600 字节,采样间隔设置为 2048 纳秒。
cumulus@switch:~$ nv set interface swp1-8 telemetry histogram ingress-buffer priority-group 0
cumulus@switch:~$ nv set interface swp9-16 telemetry histogram ingress-buffer priority-group 1 bin-min-boundary 768
cumulus@switch:~$ nv set interface swp9-16 telemetry histogram ingress-buffer priority-group 1 histogram-size 9600
cumulus@switch:~$ nv set interface swp9-16 telemetry histogram ingress-buffer priority-group 1 sample-interval 2048
cumulus@switch:~$ nv config apply
以下示例配置计数器直方图,并将最小边界尺寸设置为 960,直方图尺寸设置为 12288,采样间隔设置为 1024。直方图监控所有计数器类型。这些设置适用于已启用 counter 直方图的接口,并且在接口级别没有为这些设置配置不同的值
cumulus@switch:~$ nv set system telemetry histogram counter bin-min-boundary 960
cumulus@switch:~$ nv set system telemetry histogram counter histogram-size 12288
cumulus@switch:~$ nv set system telemetry histogram counter sample-interval 1024
cumulus@switch:~$ nv config apply
以下示例在 swp1 到 swp8 上启用计数器直方图,并使用最小边界尺寸、直方图尺寸和采样间隔的全局设置。直方图监控端口 1 到 8 上的所有已接收数据包计数器
cumulus@switch:~$ nv set interface swp1-8 telemetry histogram counter counter-type rx-packet
cumulus@switch:~$ nv config apply
以下示例配置延迟直方图,并将最小边界尺寸设置为 960,直方图尺寸设置为 12288。这些设置适用于已启用 latency 直方图的接口,并且在接口级别没有为这些设置配置不同的值
cumulus@switch:~$ nv set system telemetry histogram latency bin-min-boundary 960
cumulus@switch:~$ nv set system telemetry histogram latency histogram-size 12288
cumulus@switch:~$ nv config apply
以下示例为 swp1 到 swp8 上的流量类别 0 启用延迟直方图,并使用全局应用的最小边界和直方图尺寸。该示例还为 swp9 到 swp16 上的流量类别 1 启用延迟直方图,并将最小边界设置为 768 字节,直方图尺寸设置为 9600 字节。
cumulus@switch:~$ nv set system telemetry enable on
cumulus@switch:~$ nv set interface swp1-8 telemetry histogram latency traffic-class 0
cumulus@switch:~$ nv set interface swp9-16 telemetry histogram latency traffic-class 1 bin-min-boundary 768
cumulus@switch:~$ nv set interface swp9-16 telemetry histogram latency traffic-class 1 histogram-size 9600
cumulus@switch:~$ nv config apply
编辑 /etc/cumulus/datapath/monitor.conf 文件中的设置,然后使用 systemctl restart asic-monitor.service 命令重启 asic-monitor 服务。asic-monitor 服务读取新的配置文件,然后运行直到您使用 systemctl stop asic-monitor.service 命令停止该服务。
下表描述了 ASIC 监控器设置。
| 设置 | 描述 |
|---|---|
port_group_list | 指定要用于收集数据的监控器(端口组)的名称,例如 histogram_pg。您可以为端口组提供任何您想要的名称。您必须为所有端口组设置使用相同的名称。示例 monitor.port_group_list = [histogram_pg,discards_pg,buffers_pg,all_packets_pg]注意:您必须至少指定一个端口组。如果端口组列表为空,则 systemd 关闭 asic-monitor 服务。 |
<port_group_name>.port_set | 指定要监控的端口范围,例如 swp4,swp8,swp10-swp50。要指定所有端口,请使用 all_ports 选项。示例 monitor.histogram_pg.port_set = swp1-swp50 monitor.histogram_pg.port_set = all_ports |
<port_group_name>.stat_type | 指定端口组收集的数据类型。 对于出口队列长度直方图,请指定 histogram_tc。例如monitor.histogram_pg.stat_type = histogram_tc对于入口队列长度直方图,请指定 histogram_pg。例如monitor.histogram_pg.stat_type = histogram_pg对于计数器直方图,请指定 histogram_counter。例如monitor.histogram_pg.stat_type = histogram_counter. 对于延迟直方图,请指定 histogram_latency。例如monitor.histogram_pg.stat_type = histogram_latency. |
<port_group_name>.cos_list | 对于直方图监控,列表中的每个 CoS(服务类别)值在每个端口上都有其自己的直方图。直方图数量的全局限制是每个端口平均一个直方图。 示例 monitor.histogram_pg.cos_list = [0] |
<port_group_name>.counter_type | 指定计数器直方图监控的计数器类型。计数器类型可以是 tx-pkt、rx-pkt、tx-byte、rx-byte。示例 monitor.histogram_pg.counter_type = [rx_byte] |
<port_group_name>.trigger_type | 指定启动数据收集的触发器类型。唯一的选项是 timer。至少一个端口组必须配置计时器,否则永远不会收集数据。 示例 monitor.histogram_pg.trigger_type = timer |
<port_group_name>.timer | 指定数据收集的频率;例如,设置为 1 秒表示每秒收集一次数据。您可以将计时器设置为以下值 1 到 60 秒:1 秒、2 秒,依此类推,最高 60 秒 1 到 60 分钟:1 分钟、2 分钟,依此类推,最高 60 分钟 1 到 24 小时:1 小时、2 小时,依此类推,最高 24 小时 1 到 7 天:1 天、2 天,依此类推,最高 7 天 示例 monitor.histogram_pg.timer = 4s |
<port_group_name>.histogram.minimum_bytes_boundary | 对于直方图监控. 直方图的最小边界尺寸,以字节为单位。在 Spectrum 交换机上,此数字必须是 96 的倍数。将此数字添加到直方图的尺寸会产生最大边界尺寸。这些值表示每个箱的队列长度范围。 示例 monitor.histogram_pg.histogram.minimum_bytes_boundary = 960 |
<port_group_name>.histogram.histogram_size_bytes | 对于直方图监控. 直方图的尺寸,以字节为单位。将此数字和 minimum_bytes_boundary 值加在一起会产生最大边界尺寸。这些值表示每个箱的队列长度范围。 示例 monitor.histogram_pg.histogram.histogram_size_bytes = 12288 |
<port_group_name>.histogram.sample_time_ns | 对于直方图监控. 直方图的采样时间,以纳秒为单位。 示例 monitor.histogram_pg.histogram.sample_time_ns = 1024 |
以下示例配置出口队列长度直方图,并将最小边界尺寸设置为 960,直方图尺寸设置为 12288,采样间隔设置为 1024。直方图每秒收集一次数据,适用于所有端口上的流量类别 0 到 15
cumulus@switch:~$ sudo nano /etc/cumulus/datapath/monitor.conf
...
monitor.port_group_list                               = [histogram_pg]
monitor.histogram_pg.port_set                         = allports
monitor.histogram_pg.stat_type                        = histogram_tc
monitor.histogram_pg.cos_list                         = [0-15]
monitor.histogram_pg.trigger_type                     = timer
monitor.histogram_pg.timer                            = 1s
...
monitor.histogram_pg.histogram.minimum_bytes_boundary = 960
monitor.histogram_pg.histogram.histogram_size_bytes   = 12288
monitor.histogram_pg.histogram.sample_time_ns         = 1024
以下示例配置出口队列长度直方图,并将最小边界设置为 960 字节,直方图尺寸设置为 12288 字节,采样间隔设置为 1024 纳秒。直方图每秒收集一次数据,适用于 swp1 到 swp8 上的流量类别 0 和 swp9 到 swp16 上的流量类别 1。
cumulus@switch:~$ sudo nano /etc/cumulus/datapath/monitor.conf
...
monitor.port_group_list                                = [histogram_gr1, histogram_gr2]
monitor.histogram_gr1.port_set                         = swp1-swp8
monitor.histogram_gr1.stat_type                        = histogram_tc
monitor.histogram_gr1.cos_list                         = [0]
monitor.histogram_gr1.trigger_type                     = timer
monitor.histogram_gr1.timer                            = 1s
...
monitor.histogram_gr1.histogram.minimum_bytes_boundary = 960
monitor.histogram_gr1.histogram.histogram_size_bytes   = 12288
monitor.histogram_gr1.histogram.sample_time_ns         = 1024
monitor.histogram_gr2.port_set                         = swp9-swp16
monitor.histogram_gr2.stat_type                        = histogram_tc
monitor.histogram_gr2.cos_list                         = [1]
monitor.histogram_gr2.trigger_type                     = timer
monitor.histogram_gr2.timer                            = 1s
…
monitor.histogram_gr2.histogram.minimum_bytes_boundary = 960
monitor.histogram_gr2.histogram.histogram_size_bytes   = 12288
monitor.histogram_gr2.histogram.sample_time_ns         = 1024
以下示例配置入口队列长度直方图,并将最小边界尺寸设置为 960 字节,直方图尺寸设置为 12288 字节,采样间隔设置为 1024 纳秒。直方图每秒收集一次数据,适用于所有端口上的优先级组 1 到 15。
cumulus@switch:~$ sudo nano /etc/cumulus/datapath/monitor.conf
...
monitor.port_group_list                               = [histogram_pg]
monitor.histogram_pg.port_set                         = allports
monitor.histogram_pg.stat_type                        = histogram_pg
monitor.histogram_pg.cos_list                         = [0-15]
monitor.histogram_pg.trigger_type                     = timer
monitor.histogram_pg.timer                            = 1s
...
monitor.histogram_pg.histogram.minimum_bytes_boundary = 960
monitor.histogram_pg.histogram.histogram_size_bytes   = 12288
monitor.histogram_pg.histogram.sample_time_ns         = 1024
以下示例配置入口队列长度直方图,并将最小边界尺寸设置为 960,直方图尺寸设置为 12288,采样间隔设置为 1024。直方图监控端口 1 到 8 上的优先级组 0 和端口 9 到 16 上的优先级组 1
cumulus@switch:~$ sudo nano /etc/cumulus/datapath/monitor.conf
...
monitor.port_group_list                                = [histogram_gr1, histogram_gr2]
monitor.histogram_gr1.port_set                         = swp1-swp8
monitor.histogram_gr1.stat_type                        = histogram_pg
monitor.histogram_gr1.cos_list                         = [0]
monitor.histogram_gr1.trigger_type                     = timer
monitor.histogram_gr1.timer                            = 1s
...
monitor.histogram_gr1.histogram.minimum_bytes_boundary = 960
monitor.histogram_gr1.histogram.histogram_size_bytes   = 12288
monitor.histogram_gr1.histogram.sample_time_ns         = 1024
monitor.histogram_gr2.port_set                         = swp9-swp16
monitor.histogram_gr2.stat_type                        = histogram_pg
monitor.histogram_gr2.cos_list                         = [1]
monitor.histogram_gr2.trigger_type                     = timer
monitor.histogram_gr2.timer                            = 1s
…
monitor.histogram_gr2.histogram.minimum_bytes_boundary = 960
monitor.histogram_gr2.histogram.histogram_size_bytes   = 12288
monitor.histogram_gr2.histogram.sample_time_ns         = 1024
以下示例配置计数器直方图,并将最小边界尺寸设置为 960,直方图尺寸设置为 12288,采样间隔设置为 1024。直方图监控所有计数器类型
cumulus@switch:~$ sudo nano /etc/cumulus/datapath/monitor.conf
...
monitor.port_group_list                               = [histogram_pg]
monitor.histogram_pg.port_set                         = allports
monitor.histogram_pg.stat_type                        = histogram_counter
monitor.histogram_pg.counter_type                     = [tx-pkt,rx-pkt,tx-byte,rx-byte]
monitor.histogram_pg.trigger_type                     = timer
monitor.histogram_pg.timer                            = 1s
...
monitor.histogram_pg.histogram.minimum_bytes_boundary = 960
monitor.histogram_pg.histogram.histogram_size_bytes   = 12288
monitor.histogram_pg.histogram.sample_time_ns         = 1024
以下示例配置计数器直方图,并将最小边界尺寸设置为 960,直方图尺寸设置为 12288,采样间隔设置为 1024。直方图监控端口 1 到 8 上的所有已接收数据包
cumulus@switch:~$ sudo nano /etc/cumulus/datapath/monitor.conf
...
monitor.port_group_list                               = [histogram_pg]
monitor.histogram_pg.port_set                         = swp1-swp8
monitor.histogram_pg.stat_type                        = histogram_counter
monitor.histogram_pg.counter_type                     = [tx-pkt]
monitor.histogram_pg.trigger_type                     = timer
monitor.histogram_pg.timer                            = 1s
...
monitor.histogram_pg.histogram.minimum_bytes_boundary = 960
monitor.histogram_pg.histogram.histogram_size_bytes   = 12288
monitor.histogram_pg.histogram.sample_time_ns         = 1024
以下示例配置延迟直方图,并将最小边界尺寸设置为 960,直方图尺寸设置为 12288。这些设置适用于已启用 latency 直方图的接口,并且在接口级别没有为这些设置配置不同的值
cumulus@switch:~$ sudo nano /etc/cumulus/datapath/monitor.conf
...
monitor.port_group_list                               = [latency_pg]
monitor.histogram_pg.port_set                         = allports
monitor.histogram_pg.stat_type                        = histogram_latency
monitor.histogram_pg.cos_list                         = [0-15]
monitor.histogram_pg.trigger_type                     = timer
monitor.histogram_pg.timer                            = 1s
...
monitor.histogram_pg.histogram.minimum_bytes_boundary = 960
monitor.histogram_pg.histogram.histogram_size_bytes   = 12288
以下示例为 swp1 到 swp8 上的流量类别 0 启用延迟直方图,并使用全局应用的最小边界和直方图尺寸。该示例还为 swp9 到 swp16 上的流量类别 1 启用延迟直方图,并将最小边界设置为 768 字节,直方图尺寸设置为 9600 字节。
cumulus@switch:~$ sudo nano /etc/cumulus/datapath/monitor.conf
...
monitor.port_group_list                                = [histogram_gr1, histogram_gr2]
monitor.histogram_gr1.port_set                         = swp1-swp8
monitor.histogram_gr1.stat_type                        = histogram_latency
monitor.histogram_gr1.cos_list                         = [0]
monitor.histogram_gr1.trigger_type                     = timer
monitor.histogram_gr1.timer                            = 1s
...
monitor.histogram_gr1.histogram.minimum_bytes_boundary = 960
monitor.histogram_gr1.histogram.histogram_size_bytes   = 12288
monitor.histogram_gr2.port_set                         = swp9-swp16
monitor.histogram_gr2.stat_type                        = histogram_latency
monitor.histogram_gr2.cos_list                         = [1]
monitor.histogram_gr2.trigger_type                     = timer
monitor.histogram_gr2.timer                            = 1s
…
monitor.histogram_gr2.histogram.minimum_bytes_boundary = 960
monitor.histogram_gr2.histogram.histogram_size_bytes   = 12288
在以下示例中
- swp1 到 swp50 上的数据包丢失每两秒收集一次。
- 如果数据包丢失的数量大于 100,则结果将写入
/var/lib/cumulus/discard_stats快照文件,并且系统会向/var/log/syslog文件发送消息。
monitor.port_group_list                            = [discards_pg]
monitor.discards_pg.port_set                       = swp1-swp50
monitor.discards_pg.stat_type                      = packet
monitor.discards_pg.action_list                    = [snapshot,log]
monitor.discards_pg.trigger_type                   = timer
monitor.discards_pg.timer                          = 2s
monitor.discards_pg.log.packet_error_drops         = 100
monitor.discards_pg.snapshot.packet_error_drops    = 100
monitor.discards_pg.snapshot.file                  = /var/lib/cumulus/discard_stats
monitor.discards_pg.snapshot.file_count            = 16
收集操作触发附加信息的收集。您可以将多个监控器(端口组)链接到一个收集操作中。
在以下示例中
- swp1 到 swp50 的队列长度直方图每秒收集一次。
- 结果写入
/var/run/cumulus/histogram_stats快照文件。 - 当队列长度达到 500 字节时,系统会向 /var/log/syslog 文件发送消息并收集附加数据;每个端口的缓冲区占用率和所有数据包。
- 缓冲区占用率数据写入
/var/lib/cumulus/buffer_stats快照文件,每个端口的所有数据包数据写入/var/lib/cumulus/all_packet_stats快照文件。 - 此外,swp1 到 swp50 上的数据包丢失每两秒收集一次。如果数据包丢失的数量大于 100,则监控器会将结果写入
/var/lib/cumulus/discard_stats快照文件,并向/var/log/syslog文件发送消息。
monitor.port_group_list = [histogram_pg,discards_pg]monitor.histogram_pg.port_set = swp1-swp50 monitor.histogram_pg.stat_type = buffer monitor.histogram_pg.cos_list = [0] monitor.histogram_pg.trigger_type = timer monitor.histogram_pg.timer = 1s monitor.histogram_pg.action_list = [snapshot,collect,log] monitor.histogram_pg.snapshot.file = /var/run/cumulus/histogram_stats monitor.histogram_pg.snapshot.file_count = 64 monitor.histogram_pg.histogram.minimum_bytes_boundary = 960 monitor.histogram_pg.histogram.histogram_size_bytes = 12288 monitor.histogram_pg.histogram.sample_time_ns = 1024 monitor.histogram_pg.log.queue_bytes = 500 monitor.histogram_pg.collect.queue_bytes = 500 monitor.histogram_pg.collect.port_group_list = [buffers_pg,all_packet_pg]
monitor.buffers_pg.port_set = swp1-swp50 monitor.buffers_pg.stat_type = buffer monitor.buffers_pg.action_list = [snapshot] monitor.buffers_pg.snapshot.file = /var/lib/cumulus/buffer_stats monitor.buffers_pg.snapshot.file_count = 8
monitor.all_packet_pg.port_set = swp1-swp50 monitor.all_packet_pg.stat_type = packet_all monitor.all_packet_pg.action_list = [snapshot] monitor.all_packet_pg.snapshot.file = /var/lib/cumulus/all_packet_stats monitor.all_packet_pg.snapshot.file_count = 8
monitor.discards_pg.port_set = swp1-swp50 monitor.discards_pg.stat_type = packet monitor.discards_pg.action_list = [snapshot,log] monitor.discards_pg.trigger_type = timer monitor.discards_pg.timer = 2s monitor.discards_pg.log.packet_error_drops = 100 monitor.discards_pg.snapshot.packet_error_drops = 100 monitor.discards_pg.snapshot.file = /var/lib/cumulus/discard_stats monitor.discards_pg.snapshot.file_count = 16
带宽仪表
Cumulus Linux 仅在 Spectrum-4 交换机上支持带宽仪表选项。
要跟踪接口的带宽使用情况,您可以使用 nv set interface <interface-id> telemetry bw-gauge enable on 命令启用带宽仪表选项
cumulus@switch:~$ nv set interface swp1 telemetry bw-gauge enable on
cumulus@switch:~$ nv config apply
要禁用带宽仪表设置,请运行 nv set interface <interface-id> telemetry bw-gauge enable off 命令。
要显示接口的带宽仪表设置,请运行 nv show interface <interface> telemetry bw-gauge 命令
cumulus@switch:~$ nv show interface swp1 telemetry bw-gauge
        operational  applied
------  -----------  -------
enable  on           on
要显示接口带宽的摘要,请运行 nv show system telemetry bw-gauge interface 命令
cumulus@switch:~$ nv show system telemetry bw-gauge interface
Interface  Tx (Mbps)  Rx (Mbps)
---------  ---------  ---------
swp1       4          4
快照
要创建快照
- 设置写入快照文件的频率。默认值为 1 秒。
- 提供快照文件名和位置。默认位置和文件名为
/var/run/cumulus/histogram_stats。 - 配置在 Cumulus Linux 覆盖第一个快照文件之前要创建的快照数。例如,如果您将快照文件计数设置为 30,则第一个快照文件为
histogram_stats_0,第 30 个快照文件为histogram_stats_30。在第 30 个快照之后,Cumulus Linux 会覆盖原始快照文件 (histogram_stats_0),并且序列重新开始。默认值为 64。
快照为您提供更多数据;但是,它们可能会占用交换机上大量的磁盘空间。要减少磁盘使用量,您可以为快照文件使用易失性分区;例如,/var/run/cumulus/histogram_stats。
以下示例每 5 秒创建一次 /var/run/cumulus/histogram_stats 快照。在覆盖第一个快照文件之前可以创建的快照数设置为 30。
cumulus@switch:~$ nv set system telemetry snapshot-file name /var/run/cumulus/histogram_stats
cumulus@switch:~$ nv set system telemetry snapshot-file count 30
cumulus@switch:~$ nv set system telemetry snapshot-interval 5
cumulus@switch:~$ nv config apply
编辑 /etc/cumulus/datapath/monitor.conf 文件中的 snapshot.file 设置,然后使用 systemctl restart asic-monitor.service 命令重启 asic-monitor 服务。asic-monitor 服务读取新的配置文件,然后运行直到您使用 systemctl stop asic-monitor.service 命令停止该服务。
| 设置 | 描述 |
|---|---|
<port_group_name>.action_list | 指定数据收集时发生的一个或多个操作snapshot 将数据收集结果的快照写入文件。如果您指定此操作,则还必须指定快照文件(如下所述)。您还可以指定启动快照操作的阈值。示例 monitor.histogram_pg.action_list = [snapshot] collect 收集附加数据。如果您指定此操作,则还必须指定要收集的附加数据的端口组。示例 monitor.histogram_pg.action_list = [collect log 向 /var/log/syslog 文件发送消息。如果您指定此操作,则还必须指定启动日志操作的阈值。示例 monitor.histogram_pg.action_list = [log]您可以在一个监控步骤中使用所有这三个操作。例如 monitor.histogram_pg.action_list = [snapshot,collect,log]注意:如果操作出现在操作列表中,但没有所需的设置(例如日志操作的阈值),ASIC 监视器将停止并报告错误。 |
<端口组名称>.snapshot.file | 指定快照文件的名称。所有快照都使用此名称,并在其后附加一个序号。请参阅 snapshot.file_count 设置。示例 monitor.histogram_pg.snapshot.file = /var/run/cumulus/histogram_stats |
<端口组名称>.snapshot.file_count | 指定在 Cumulus Linux 覆盖第一个快照文件之前可以创建的快照数量。在以下示例中,由于快照文件计数设置为 64,因此第一个快照文件为 histogram_stats_0,第 64 个快照文件为 histogram_stats_63。在第 65 个快照之后,Cumulus Linux 将覆盖原始快照文件 (histogram_stats_0) 并重新开始序列。示例 monitor.histogram_pg.snapshot.file_count = 64注意:虽然更多快照可以为您提供更多数据,但它们可能会占用交换机上大量的磁盘空间。 |
- 要显示入口队列快照,请运行
nv show interface <接口> telemetry histogram ingress-buffer priority-group <值> snapshot命令 - 要显示出口队列快照,请运行
nv show interface <接口> telemetry histogram egress-buffer traffic-class <类型> snapshot命令 - 要显示计数器快照,请运行
nv show interface <接口> telemetry histogram counter counter-type <类型> snapshot命令 - 要显示延迟快照,请运行
nv show interface <接口> telemetry histogram latency traffic-class <类型> snapshot命令
以下示例显示入口队列快照
cumulus@switch:~$ nv show interface swp1 telemetry histogram ingress-buffer priority-group 0 snapshot
Sl.No  Date-Time            Bin-0   Bin-1    Bin-2    Bin-3    Bin-4    Bin-5    Bin-6    Bin-7     Bin-8     Bin-9
-----  -------------------  ------  -------  -------  -------  -------  -------  -------  --------  --------  ---------
0      -                    (<864)  (<2304)  (<3744)  (<5184)  (<6624)  (<8064)  (<9504)  (<10944)  (<12384)  (>=12384)
1      2023-12-13 11:02:44  980318  0        0        0        0        0        0        0         0         0
2      2023-12-13 11:02:43  980318  0        0        0        0        0        0        0         0         0
3      2023-12-13 11:02:42  980318  0        0        0        0        0        0        0         0         0
4      2023-12-13 11:02:41  980318  0        0        0        0        0        0        0         0         0
5      2023-12-13 11:02:40  980488  0        0        0        0        0        0        0         0         0
6      2023-12-13 11:02:39  980149  0        0        0        0        0        0        0         0         0
7      2023-12-13 11:02:38  979809  0        0        0        0        0        0        0         0         0
8      2023-12-13 11:02:37  980488  0        0        0        0        0        0        0         0         0
9      2023-12-13 11:02:36  980318  0        0        0        0        0        0        0         0         0
解析快照文件并找到您需要的信息可能很繁琐;请使用第三方分析工具来分析文件中的数据。
日志文件
除了快照之外,您还可以配置交换机,以便在队列长度达到指定的字节数、计数器达到指定的值或延迟达到指定的纳秒数时,将日志消息发送到 /var/log/syslog 文件。
以下示例在 swp9 到 swp16 上的优先级组 1 的入口队列长度达到 5000 字节后,将消息发送到 /var/log/syslog 文件
cumulus@switch:~$ nv set interface swp9-16 telemetry histogram ingress-buffer priority-group 1 threshold action log
cumulus@switch:~$ nv set interface swp9-16 telemetry histogram ingress-buffer priority-group 1 threshold value 5000
cumulus@switch:~$ nv config apply
以下示例在 swp1 到 swp8 上接收的数据包数量达到 500 后,将消息发送到 /var/log/syslog 文件
cumulus@switch:~$ nv set interface swp1-8 telemetry histogram counter counter-type rx-packet threshold log
cumulus@switch:~$ nv set interface swp1-8 telemetry histogram counter counter-type rx-packet threshold value 500
cumulus@switch:~$ nv config apply
以下示例在 swp1 到 swp8 上的流量类别 0 的数据包延迟达到 500 纳秒后,将消息发送到 /var/log/syslog 文件
cumulus@switch:~$ nv set interface swp1-8 telemetry histogram latency traffic-class 0 threshold action log
cumulus@switch:~$ nv set interface swp1-8 telemetry histogram latency traffic-class 0 threshold value 500
cumulus@switch:~$ nv config apply
在 /etc/cumulus/datapath/monitor.conf 文件中设置日志选项,然后使用 systemctl restart asic-monitor.service 命令重启 asic-monitor 服务。asic-monitor 服务读取新的配置文件,然后运行,直到您使用 systemctl stop asic-monitor.service 命令停止该服务。
| 设置 | 描述 |
|---|---|
<端口组名称>.log.action_list | 将此选项设置为 log 以在队列长度或计数器数量达到设定的阈值时创建日志消息。 |
<端口组名称>.log.queue_bytes | 指定队列长度(以字节为单位),超过此长度后,交换机将发送日志消息。 |
<端口组名称>.log.count | 指定要达到的计数器数量,超过此数量后,交换机将发送日志消息。 |
<端口组名称>.log.value | 指定要达到的延迟纳秒数,超过此数量后,交换机将发送日志消息。 |
以下示例在入口队列长度达到 5000 字节后,将消息发送到 /var/log/syslog 文件
...
monitor.histogram_pg.action_list  = [log]
...
monitor.histogram_pg.log.queue_bytes  = 5000
以下示例在数据包数量达到 500 后,将消息发送到 /var/log/syslog 文件
...
monitor.histogram_pg.action_list  = [log]
...
monitor.histogram_pg.log.count  = 500
以下示例在数据包延迟达到 500 纳秒后,将消息发送到 /var/log/syslog 文件
...
monitor.histogram_pg.action_list  = [log]
...
monitor.histogram_pg.log.value  = 500
以下显示了 syslog 消息示例
2018-02-26T20:14:41.560840+00:00 cumulus asic-monitor-module INFO: 2018-02-26 20:14:41.559967: Egress queue(s) greater than 500 bytes in monitor port group histogram_pg.
在收集数据时,交换机同时使用 CPU 和 SDK 进程,这可能会影响 switchd。如果您不限制快照和日志的数量,它们可能会占用大量的磁盘空间。
显示柱状图信息
要显示启用柱状图的接口列表,请运行 nv show system telemetry histogram interface 命令
cumulus@switch:~$ nv show system telemetry histogram interface
Interface         ingress-buffer          egress-buffer            counter
---------------------------------------------------------------------------------------
swp1              0,1,2                   -                        tx-byte,rx-byte
swp2              -                       0,1,8                    tx-byte,tx-byte
要显示在配置的时间间隔内为端口的流量类别收集的出口队列深度柱状图样本,请运行 nv show interface <接口> telemetry histogram egress-buffer traffic-class <流量类别> 命令。
cumulus@switch:~$ nv show interface swp1 telemetry histogram egress-buffer traffic-class 0
Time         0-863     864:2303    2304:3743.  3744:5183   5184:6623   6624:8063   8064:9503 9. 504:10943   10944:12383
12384:*
----------------------------------------------------------------------------------------------------------------------------------------------------------------------------
08:56:19     978065        0           0           0          0            0           0             0          0
08:56:20     978532        0           0           0          0            0           0             0          0
要显示在配置的时间间隔内为端口的优先级组收集的入口队列深度柱状图样本,请运行 nv show interface <接口> telemetry histogram ingress-buffer priority-group <优先级组> 命令。
cumulus@switch:~$ nv show interface swp1 telemetry histogram ingress-buffer priority-group 0
Time      0-863     864:2303    2304:3743  3744:5183   5184:6623   6624:8063   8064:9503 9. 504:10943   10944:12383
12384:*
----------------------------------------------------------------------------------------------------------------------------------------------------------------------------
08:56:19  978065        0          0           0           0            0           0           0             0
08:56:20  978532        0          0           0           0            0           0           0             0
接口数据包和缓冲区统计信息
接口数据包和缓冲区统计信息显示有关所有、良好和丢弃的数据包以及接口入口和出口缓冲区占用率的信息。
接口数据包和缓冲区统计信息收集
要监控接口数据包和缓冲区统计信息,您需要指定
- 要收集的数据类型。您可以收集以下数据类型
- 所有、良好和丢弃的数据包,以及入口和出口队列占用率 (
packet-all) - 所有和良好的数据包 (
packet) - 所有、良好和丢弃的数据包 (
packet-extended) - 入口和出口队列占用率 (
buffer)
- 所有、良好和丢弃的数据包,以及入口和出口队列占用率 (
- 要监控的交换机端口。
- 时间间隔计时器(将接口统计信息发送到快照文件的频率)。此设置没有默认值。如果您未配置此设置,则必须配置 collect 操作。您还可以选择将消息发送到
/var/log/syslog文件。
交换机限制每 10 秒收集 128 个端口的统计信息,或每秒收集 13 个端口的统计信息。
以下示例在所有接口上启用数据包和缓冲区数据收集。交换机每十五秒将有关所有、良好和丢弃的数据包以及入口和出口队列占用率的接口统计信息发送到默认快照文件。
cumulus@switch:~$ nv set system telemetry enable on
cumulus@switch:~$ nv set system telemetry snapshot port-group packet-all-pg interface all
cumulus@switch:~$ nv set system telemetry snapshot port-group packet-all-pg stats-type packet-all
cumulus@switch:~$ nv set system telemetry snapshot port-group packet-all-pg timer-interval 15
cumulus@switch:~$ nv config apply
以下示例在 swp1 到 swp8 上启用数据包和缓冲区数据收集。交换机每十秒将有关入口和出口队列占用率的接口统计信息发送到默认快照文件。
cumulus@switch:~$ nv set system telemetry enable on
cumulus@switch:~$ nv set system telemetry snapshot port-group packet-all-pg interface swp1-8
cumulus@switch:~$ nv set system telemetry snapshot port-group packet-all-pg stats-type buffer
cumulus@switch:~$ nv set system telemetry snapshot port-group packet-all-pg timer-interval 10
cumulus@switch:~$ nv config apply
以下示例在所有接口上启用数据包和缓冲区数据收集。交换机每十五秒将有关所有和良好的数据包的接口统计信息发送到默认快照文件。
cumulus@switch:~$ nv set system telemetry enable on
cumulus@switch:~$ nv set system telemetry snapshot port-group packet-all-pg interface all
cumulus@switch:~$ nv set system telemetry snapshot port-group packet-all-pg stats-type packet
cumulus@switch:~$ nv set system telemetry snapshot port-group packet-all-pg timer-interval 15
cumulus@switch:~$ nv config apply
以下示例在所有接口上启用数据包和缓冲区数据收集。交换机每十五秒将有关所有、良好和丢弃的数据包的接口统计信息发送到默认快照文件。
cumulus@switch:~$ nv set system telemetry enable on
cumulus@switch:~$ nv set system telemetry snapshot port-group packet-all-pg interface all
cumulus@switch:~$ nv set system telemetry snapshot port-group packet-all-pg stats-type packet-extended
cumulus@switch:~$ nv set system telemetry snapshot port-group packet-all-pg timer-interval 15
cumulus@switch:~$ nv config apply
编辑 /etc/cumulus/datapath/monitor.conf 文件中的设置,然后使用 systemctl restart asic-monitor.service 命令重启 asic-monitor 服务。
下表描述了 ASIC 监控器设置。
| 设置 | 描述 |
|---|---|
port_group_list | 指定您要用于收集数据的监视器(端口组)的名称,例如 buffers_pg。您可以为端口组提供任何您想要的名称。您必须对所有端口组设置使用相同的名称。您必须至少指定一个端口组。如果端口组列表为空,则 systemd 将关闭 asic-monitor 服务。 |
<port_group_name>.port_set | 指定您要监控的端口范围,例如 swp4,swp8,swp10-swp50 或 all。 |
<port_group_name>.stat_type | 指定端口组收集的数据类型;packet_all、buffer、packet 或 packet_extended。 |
<port_group_name>.timer | 指定交换机将数据发送到快照文件的频率;例如,如果您指定 1s,则交换机每秒发送一次数据。 |
以下示例在所有接口上启用数据包和缓冲区统计信息。交换机每十五秒将所有接口统计信息发送到默认快照文件。
cumulus@switch:~$ sudo nano /etc/cumulus/datapath/monitor.conf
...
monitor.packet-all-pg_packet_all.port_set            = all
monitor.packet-all-pg_packet_all.stat_type           = packet_all
monitor.packet-all-pg_packet_all.trigger_type        = timer
monitor.packet-all-pg_packet_all.timer               = 15s
monitor.packet-all-pg_packet_all.action_list         = [snapshot]
monitor.packet-all-pg_packet_all.snapshot.file       = /var/run/cumulus/intf_stats_packet-all-pg
monitor.packet-all-pg_packet_all.snapshot.file_count = 64
以下示例在 swp1 到 swp8 上启用数据包和缓冲区数据收集。交换机每十秒将有关入口和出口队列占用率的接口统计信息发送到默认快照文件。
cumulus@switch:~$ sudo nano /etc/cumulus/datapath/monitor.conf
...
monitor.packet-all-pg_buffer.port_set            = swp1,swp2,swp3,swp4,swp5,swp6,swp7,swp8
monitor.packet-all-pg_buffer.stat_type           = buffer
monitor.packet-all-pg_buffer.trigger_type        = timer
monitor.packet-all-pg_buffer.timer               = 10s
monitor.packet-all-pg_buffer.action_list         = [snapshot]
monitor.packet-all-pg_buffer.snapshot.file       = /var/run/cumulus/intf_stats_packet-all-pg
monitor.packet-all-pg_buffer.snapshot.file_count = 120
以下示例在所有接口上启用数据包和缓冲区数据收集。交换机每十五秒将有关所有和良好的数据包的接口统计信息发送到默认快照文件。
cumulus@switch:~$ sudo nano /etc/cumulus/datapath/monitor.conf
...
monitor.packet-all-pg_packet.port_set            = all
monitor.packet-all-pg_packet.stat_type           = packet
monitor.packet-all-pg_packet.trigger_type        = timer
monitor.packet-all-pg_packet.timer               = 15s
monitor.packet-all-pg_packet.action_list         = [snapshot]
monitor.packet-all-pg_packet.snapshot.file       = /var/run/cumulus/intf_stats_packet-all-pg
monitor.packet-all-pg_packet.snapshot.file_count = 64
以下示例在所有接口上启用数据包和缓冲区数据收集。交换机每十五秒将有关所有、良好和丢弃的数据包的接口统计信息发送到默认快照文件。
cumulus@switch:~$ sudo nano /etc/cumulus/datapath/monitor.conf
...
monitor.packet-all-pg_packet_extended.port_set            = all
monitor.packet-all-pg_packet_extended.stat_type           = packet_extended
monitor.packet-all-pg_packet_extended.trigger_type        = timer
monitor.packet-all-pg_packet_extended.timer               = 15s
monitor.packet-all-pg_packet_extended.action_list         = [snapshot]
monitor.packet-all-pg_packet_extended.snapshot.file       = /var/run/cumulus/intf_stats_packet-all-pg
monitor.packet-all-pg_packet_extended.snapshot.file_count = 64
快照
当您配置数据包和缓冲区统计信息收集并在秒内设置计时器时,Cumulus Linux 默认将数据包和缓冲区统计信息保存到 /var/run/cumulus/intf_stats_<端口组> 文件。
您可以更改快照目录和文件名。您还可以更改在 Cumulus Linux 覆盖第一个快照文件之前要创建的快照数量。例如,如果您将快照文件计数设置为 30,则第一个快照文件为 intf_stats_<端口组>_0,第 30 个快照文件为 intf_stats_<端口组>_30。在第 30 个快照之后,Cumulus Linux 将覆盖原始快照文件 (intf_stats_<端口组>_0) 并重新开始序列。默认值为 64。
快照可以为您提供更多数据;但是,它们可能会占用交换机上大量的磁盘空间。为了减少磁盘使用量,请对快照文件使用易失性分区。
以下示例为所有接口数据包和缓冲区统计信息创建 /var/run/cumulus/all_packet_stats1 快照。在覆盖第一个快照文件之前可以创建的快照数量设置为 80。
cumulus@switch:~$ nv set system telemetry snapshot port-group packet-all-pg snapshot-file name /var/run/cumulus/all_packet_stats1
cumulus@switch:~$ nv set system telemetry snapshot port-group packet-all-pg snapshot-file count 80
cumulus@switch:~$ nv config apply
编辑 /etc/cumulus/datapath/monitor.conf 文件中的 snapshot.file 设置,然后使用 systemctl restart asic-monitor.service 命令重启 asic-monitor 服务。asic-monitor 服务读取新的配置文件,然后运行直到您使用 systemctl stop asic-monitor.service 命令停止该服务。
| 设置 | 描述 |
|---|---|
<端口组名称>.snapshot.file | 指定快照文件的名称和目录。默认快照文件为 /var/run/cumulus/intf_stats_<端口组名称>。 |
<端口组名称>.snapshot.file_count | 指定在 Cumulus Linux 覆盖第一个快照文件之前可以创建的快照数量。 |
以下示例将快照文件名设置为 all_packet_stats,目录设置为 /var/run/cumulus/packet_buffer
cumulus@switch:~$ sudo nano /etc/cumulus/datapath/monitor.conf
...
monitor.packet-all-pg_packet_extended.action_list         = [snapshot]
monitor.packet-all-pg_packet_extended.snapshot.file       = /var/run/cumulus/packet_buffer/all_packet_stats1
monitor.packet-all-pg_packet_extended.snapshot.file_count = 80
要显示数据包和缓冲区统计信息快照,请运行以下命令
nv show system telemetry snapshot port-group <端口组 ID> stats interface <接口> packet good [tx, rx]nv show system telemetry snapshot port-group <端口组 ID> stats interface <接口> packet discard [tx, rx, general]nv show system telemetry snapshot port-group <端口组 ID> stats interface <接口> packet good [tx, rx]nv show system telemetry snapshot port-group <端口组 ID> stats interface <接口> packet all [tx, rx]nv show system telemetry snapshot port-group <端口组 ID> stats interface <接口> packet pg [tx, rx]nv show system telemetry snapshot port-group <端口组 ID> stats interface <接口> packet tcnv show system telemetry snapshot port-group <端口组 ID> stats interface <接口> buffer [pg, tc, ingress-port]
以下示例显示了在 swp1 上传输的良好数据包的快照
cumulus@switch:~$ nv show system telemetry snapshot port-group all-packet-pg stats interface swp1 packet good tx
Id       Date-Time                 Packet         Byte             Mcast        Bcast         Mac Ctrl       Pause Mac Ctrl

-----    -------------------       ------------   -------------    ---------    ----------    ------------   ---------------

1         2023-12-13 11:02:44      2              268              0            0             0              0
2         2023-12-13 11:02:43      2              268              0            0             0              0
3         2023-12-13 11:02:42      2              268              0            0             0              0
以下示例显示了在 swp1 上接收的丢弃数据包的快照
cumulus@switch:~$ nv show system telemetry snapshot port-group all-packet-pg stats interface swp1 packet discard rx
Id       Date-Time                  General      Policy        Vlan         Tag Type     Opcode     Buffer   Runt     Other

-----    -------------------        ---------    -----------   -------      ----------    -------   -------  -------  --------

1         2023-12-13 11:02:44       2            0             0            0             0         0        0        0
2         2023-12-13 11:02:43       2            0             0            0             0         0        0        0
3         2023-12-13 11:02:42       2            0             0            0             0         0        0        0
以下示例显示了在 swp1 上接收的入口队列数据包的快照
cumulus@switch:~$ nv show system telemetry snapshot port-group all-packet-pg stats interface swp1 packet pg 0 tx
Id       Date-Time                 Pause Packet        Pause Duration
-----    -------------------       ------------        ---------------------

1         2023-12-13 11:02:44      0                   0
2         2023-12-13 11:02:43      0                   0
3         2023-12-13 11:02:42      0                   0
以下示例显示了 swp1 上的缓冲区占用率快照。当前值是在样本采集时缓冲的字节数,而水印值表示在样本采集期间缓冲的最高历史字节数。
cumulus@switch:~$ nv show system telemetry snapshot port-group all-packet-pg stats interface swp1 buffer pg 0
Id       Date-Time                 Current Value        Watermark
-----    -------------------       ------------         -------------
1        2023-12-13 11:02:44       0                    0
2        2023-12-13 11:02:43       0                    0
3        2023-12-13 11:02:42       0                    0
解析快照文件并找到您需要的信息可能很繁琐;请使用第三方分析工具来分析文件中的数据。
日志文件
除了快照之外,您还可以配置交换机,以便在丢弃的错误数据包或丢弃的拥塞数据包达到特定数量时,将日志消息发送到 /var/log/syslog 文件。
以下示例在 packet-all-pg 端口组中收集的丢弃错误数据包数量达到 100 后,将消息发送到 /var/log/syslog 文件
cumulus@switch:~$ nv set system telemetry snapshot port-group packet-all-pg threshold packet-error-drops value 100
cumulus@switch:~$ nv set system telemetry snapshot port-group packet-all-pg threshold packet-error-drops action log
cumulus@switch:~$ nv config apply
以下示例在 packet-all-pg 端口组中收集的丢弃拥塞数据包数量达到 100 后,将消息发送到 /var/log/syslog 文件
cumulus@switch:~$ nv set system telemetry snapshot port-group packet-all-pg threshold packet-congestion-drops value 100
cumulus@switch:~$ nv set system telemetry snapshot port-group packet-all-pg threshold packet-congestion-drops action log
cumulus@switch:~$ nv config apply
您无法为缓冲区占用率设置阈值。
在 /etc/cumulus/datapath/monitor.conf 文件中设置日志选项,然后使用 systemctl restart asic-monitor.service 命令重启 asic-monitor 服务。asic-monitor 服务读取新的配置文件,然后运行,直到您使用 systemctl stop asic-monitor.service 命令停止该服务。
| 设置 | 描述 |
|---|---|
<端口组名称>.log.action_list | 将此选项设置为 log 以在丢弃的错误数据包或丢弃的拥塞数据包达到特定数量时创建日志消息。 |
<端口组名称>.log.value | 指定要达到的丢弃数据包数量,超过此数量后,交换机将发送日志消息。 |
以下示例在 packet-all-pg 端口组中收集的丢弃拥塞数据包数量达到 100 后,将消息发送到 /var/log/syslog 文件
...
monitor.packet-all-pg.action_list  = [log]
...
monitor.packet-all-pg.log.value  = 100
在收集数据时,交换机同时使用 CPU 和 SDK 进程,这可能会影响 switchd。如果您不限制快照和日志的数量,它们可能会占用大量的磁盘空间。
收集操作
收集操作触发附加信息的收集。您可以将多个监视器(端口组)链接到一个收集操作中。
以下示例配置交换机,以便在丢弃的错误数据包数量达到 100 时收集入口和出口队列占用率统计信息
cumulus@switch:~$ nv set system telemetry snapshot port-group packet-all-pg threshold packet-error-drops value 100
cumulus@switch:~$ nv set system telemetry snapshot port-group packet-all-pg threshold packet-error-drops action collect port-group buffer-pg
cumulus@switch:~$ nv config apply
cumulus@switch:~$ sudo nano /etc/cumulus/datapath/monitor.conf
...
monitor.packet-all-pg_packet_all.port_set               = all
monitor.packet-all-pg_packet_all.stat_type                    = packet_all
monitor.packet-all-pg_packet_all.trigger_type                 = timer
monitor.packet-all-pg_packet_all.timer                        = 5s
monitor.packet-all-pg_packet_all.action_list                  = [snapshot,collect]
monitor.packet-all-pg_packet_all.snapshot.file                = /var/run/cumulus/intf_stats_packet-all-pg
monitor.packet-all-pg_packet_all.snapshot.file_count          = 64
monitor.packet-all-pg_packet_all.collect.packet_error_drops   = 100
monitor.packet-all-pg_packet_all.collect.port_group_list      = [buffer-pg_buffer]


monitor.buffer-pg_buffer.port_set                             = swp1,swp2,swp3,swp4,swp5,swp6,swp7,swp8
monitor.buffer-pg_buffer.stat_type                            = buffer
monitor.buffer-pg_buffer.action_list                          = [snapshot]
monitor.buffer-pg_buffer.snapshot.file                        = /var/run/cumulus/intf_stats_buffer-pg
monitor.buffer-pg_buffer.snapshot.file_count                  = 64
高频遥测
高频遥测使您能够以非常短的采样间隔(个位数毫秒到微秒)收集计数器。这些数据可以帮助您检测短时事件(如微突发),并提供有关事件发生的时间和持续时间的信息。
高频遥测数据提供传统柱状图无法提供的时间序列数据。这些数据可以帮助您了解流量模式的形状,并识别流量中的任何峰值或下降或抖动。
Cumulus Linux 以 json 格式文件收集高频遥测数据。您可以将该文件上传到外部位置,然后处理数据,将其绘制成时间序列图,并查看网络在高精度下的行为方式。
- Cumulus Linux 仅在 Spectrum-4 交换机上支持高频遥测。
- Cumulus Linux 不支持在使用 8 通道的端口上进行高频遥测。在 Spectrum-4 交换机上,swp1 到 swp64 使用所有 8 个通道;要运行高频遥测,您必须分解这些端口。
- 为了关联来自不同交换机的计数器,交换机必须具有相同的时间(Cumulus Linux 在其收集的计数器的元数据中添加时间戳)。您可以使用 NTP 或 PTP;但是,NVIDIA 建议使用 PTP,因为时间戳在光纤结构中的交换机之间精确到微秒级。
- 收集的数据在交换机上可用,直到您触发下一个数据收集作业或直到您重启交换机。
Cumulus Linux 提供两个选项来配置高频遥测;您可以运行 NVUE 命令或使用 Cumulus Linux 作业管理工具 (cl-hft-tool)。您可以使用 cl-hft-tool -h 查看所有 cl-hft-tool 命令选项。Cumulus Linux 建议您使用 NVUE 命令。
要配置高频遥测
配置数据收集
高频遥测使用配置文件进行数据收集。配置文件是一组配置。Cumulus Linux 提供一个名为 standard 的默认配置文件。您最多可以创建四个新配置文件(除了默认配置文件之外的四个配置文件)。
如果数据收集作业已在运行或已计划,则无法删除或修改配置文件。
要配置数据收集
- 为配置文件设置采样间隔(以微秒为单位)。您可以指定介于 100 和 12750 之间的值。该值必须是 50 的倍数。默认值为 5000 微秒。
- 指定您要为配置文件收集的数据类型。您可以收集已传输字节数、已接收字节数和当前流量类别缓冲区占用率。
standard配置文件收集所有三种数据类型。 - 如果您要收集的数据类型包括当前流量类别缓冲区占用率,请为配置文件设置出口队列优先级(流量类别 0-15)。
standard配置文件设置为 3。
使用逗号(无空格)分隔流量类别列表。例如,要设置流量类别 1、3 和 6,请指定 1,3,6。
以下示例配置 profile1,并将采样间隔设置为 1000,流量类别设置为 0、3 和 7,并将要收集的数据类型设置为流量类别缓冲区占用率 (tc-occupancy)
cumulus@switch:~$ nv set system telemetry hft profile profile1 sample-interval 1000
cumulus@switch:~$ nv set system telemetry hft profile profile1 counter tc-occupancy
cumulus@switch:~$ nv set system telemetry hft profile profile1 traffic-class 0,3,7
cumulus@switch:~$ nv config apply
以下示例配置 profile2,并将采样间隔设置为 1000,并将要收集的数据类型设置为已接收字节数 (rx-byte) 和已传输字节数 (tx-byte)。
对于您要收集的每种数据类型,您都必须指定 nv set system telemetry hft profile <配置文件 ID> counter 命令。
cumulus@switch:~$ nv set system telemetry hft profile profile2 sample-interval 1000
cumulus@switch:~$ nv set system telemetry hft profile profile2 counter rx-byte
cumulus@switch:~$ nv set system telemetry hft profile profile2 counter tx-byte
cumulus@switch:~$ nv config apply
要删除配置文件,请运行 nv unset system telemetry hft profile <配置文件 ID> 命令。
以下示例配置 profile1,并将采样间隔设置为 1000,流量类别设置为 0、3 和 7,并将要收集的数据类型设置为流量类别缓冲区占用率 (tc_curr_occupancy)
cumulus@switch:~$ cl-hft-tool profile-add --name profile1 --counter tc_curr_occupancy --tc 0,3,7 --interval 1000
以下示例配置 profile2,并将采样间隔设置为 1000,并将要收集的数据类型设置为已接收字节数 (if_in_octets) 和已传输字节数 (if_out_octets)
cumulus@switch:~$ cl-hft-tool profile-add --name profile2 --counter if_in_octets,if_out_octets --interval 1000
要删除配置文件,请运行 cl-hft-tool profile-delete --name <配置文件 ID> 命令
cumulus@switch:~$ cl-hft-tool profile-delete --name profile1
要删除所有配置文件,请运行 cl-hft-tool profile-delete --name all 命令。
配置数据导出
您可以将收集的数据本地保存到 /var/run/cumulus/hft 目录中的 json 文件中,然后使用 NVUE 命令(或 API)将 json 文件导出到外部位置。json 格式文件包括每个采样间隔的数据和收集数据的时间戳。
- 收集的数据在交换机上可用,直到您触发下一个数据收集或直到您重启交换机。
- 您必须先配置数据导出(目标),然后才能配置计划。
要将收集的数据本地保存到 json 文件,请运行 nv set system telemetry hft target local 命令
cumulus@switch:~$ nv set system telemetry hft target local
cumulus@switch:~$ nv config apply
以下示例将收集的数据本地保存到 json 文件
cumulus@switch:~$ cl-hft-tool target-add --target local
要删除目标,请运行 cl-hft-tool target-delete --target local 命令
cumulus@switch:~$ cl-hft-tool target-delete --target local
要将 json 文件导出到外部位置,请运行 NVUE nv action upload system telemetry hft job <作业 ID> <远程 URL> 命令。Cumulus Linux 支持 FTP、SCP 和 SFTP。您可以使用 nv show system telemetry hft job 命令查看作业列表。
cumulus@switch:~$ nv action upload system telemetry hft job 1 scp://root@host1:/home/telemetry/
配置计划
要配置数据收集配置文件的计划,请设置
- 开始日期和时间。您也可以使用
now选项立即开始数据收集。 - 会话持续时间(以秒为单位)。默认值为 20 秒。
- 要在其上收集数据的端口。您可以指定端口范围、多个逗号分隔的端口或
all以表示所有端口。默认值为all。
- 您最多可以计划 25 个会话(作业)。这 25 个作业是活动作业,其状态为
running(现在正在收集计数器)或pending(计划在未来的日期和时间收集数据)。除了最多 25 个活动作业之外,交换机还可以保留 10 个作业的数据(状态为completed、cancelled或failed)。 - 您必须先配置数据导出(目标),然后才能配置计划。
- 交换机 ASIC 一次只能运行一个高频遥测作业;您无法计划两个作业同时运行。
- 在计划时间与 ASIC 中的实际数据采样开始时间之间可能存在两到三秒的延迟。
以下示例配置 profile1 以在 2024-07-17 10:00:00 开始,运行 30 秒,并在 swp1s0 到 swp9s0 上收集数据。
以 YYYY-MM-DD HH:MM:SS 格式指定日期和时间。
cumulus@switch:~$ nv action schedule system telemetry hft job 2024–07-17 10:00:00 duration 30 profile profile1 ports swp1s0-swp9s0
Action executing ...
Job schedule successfull.
HFT job schedule successful: job-id 1

Action succeeded
您可以提供简短的理由说明您为何要收集数据。如果描述包含多个单词,则必须用引号将描述括起来。描述是可选的。
cumulus@switch:~$ nv action schedule system telemetry hft job 2024-07-17 10:00:00 duration 30 profile profile1 ports swp1s0-swp9s0 description "bandwidth profiling"
Action executing ...
Job schedule successfull.
HFT job schedule successful: job-id 1

Action succeeded
以下示例配置 profile2 以立即开始,运行 30 秒,并在 swp2s0 上收集数据。
cumulus@switch:~$ nv action schedule system telemetry hft job now now duration 30 profile profile2 ports swp2s0
Action executing ...
Job schedule successfull.
HFT job schedule successful: job-id 2

Action succeeded
以下示例配置 profile1 以在 2024-07-17 10:00:00 开始,运行 30 秒,并在 swp1s0 到 swp9s0 上收集数据。
以 YYYY-MM-DD-HH:MM:SS 格式指定日期和时间。
cumulus@switch:~$ cl-hft-tool job-schedule --time 2024–07-17-10:00:00 --duration 30 --profile profile1 --ports swp1s0-swp9s0
您可以提供简短的理由说明您为何要收集数据。如果描述包含多个单词,则必须用引号将描述括起来。描述是可选的。
cumulus@switch:~$ cl-hft-tool job-schedule --time 2024–07-17-10:00:00 --duration 30 --profile profile1 --ports swp1s0-swp9s0 --description "bandwidth profiling"
取消数据收集
您可以取消特定或所有数据收集作业,或特定或所有配置文件的作业。
要取消计划的遥测作业,请运行 nv action cancel system telemetry hft job <作业 ID> profile <配置文件 ID> 命令。运行 nv show system telemetry hft job 命令以查看作业 ID 列表。
以下示例取消配置文件 profile1 的所有作业
cumulus@switch:~$ nv action cancel system telemetry hft job all profile profile1
Action executing ...
Action succeeded
以下示例取消作业 6
cumulus@switch:~$ nv action cancel system telemetry hft job 6
Action executing ...
Action succeeded
要取消计划的遥测作业,请运行 cl-hft-tool job-cancel --job <作业 ID> 命令。
以下示例取消作业 6
cumulus@switch:~$ cl-hft-tool job-cancel --job 6
显示会话信息
要显示高频遥测配置和数据的摘要
cumulus@switch:~$ nv show system telemetry hft
profile
==========
    Profile        traffic-class  counter       sample-interval
    -------------  -------------  ------------  ---------------
    standard       3              rx-byte       5000
                                  tc-occupancy
                                  tx-byte
    user_profile1  0              rx-byte       1000
                   1              tc-occupancy
                   2              tx-byte

job
======
    Job  Counter                       duration  sample-interval  Start Time            Traffic Class  Status     Description
    ---  ----------------------------  --------  ---------------  --------------------  -------------  ---------  -----------
    1    tx-byte,rx-byte,tc-occupancy  20        5000             2024-07-30T05:34:23Z  3              completed  NA
    2    tx-byte,rx-byte,tc-occupancy  20        1000             2024-07-30T05:35:17Z  0-2            completed  NA
...
要显示交换机上配置的高频遥测配置文件
cumulus@switch:~$ nv show system telemetry hft profile
Profile        traffic-class  counter       sample-interval
-------------  -------------  ------------  ---------------
standard       3              rx-byte       5000
                              tc-occupancy
                              tx-byte
user_profile1  0              rx-byte       1000
               1              tc-occupancy
               2              tx-byte
要显示特定配置文件的设置
cumulus@switch:~$ nv show system telemetry hft profile profile1
                 operational  applied
---------------  -----------  -------
sample-interval  1000         1000
[traffic-class]  0            0
[traffic-class]  1            1
[traffic-class]  2            2
[traffic-class]  3            3
[traffic-class]  4            4
[traffic-class]  5            5
[traffic-class]  6            6
[traffic-class]  7            7
[traffic-class]  8            8
[traffic-class]  9            9
[counter]        rx-byte      rx-byte
[counter]        tx-byte      tx-byte
要显示配置的目标
cumulus@switch:~$ nv show system telemetry hft target
applied
-------
local
要显示所有数据收集作业的信息
cumulus@switch:~$ nv show system telemetry hft job
Job  Counter                       duration  sample-interval  Start Time            Traffic Class  Status     Description
---  ----------------------------  --------  ---------------  --------------------  -------------  ---------  -----------
1    tx-byte,rx-byte,tc-occupancy  20        5000             2024-07-30T05:34:23Z  3              completed  NA
2    tx-byte,rx-byte,tc-occupancy  20        1000             2024-07-30T05:35:17Z  0-2            completed  NA
要显示有关特定数据收集作业的信息
cumulus@switch:~$ nv show system telemetry hft job 1
duration      : 20                sample_interval : 5000
status        : completed         start_time      : 2024-07-30T05:34:23Z
traffic_class : 3                 counter         : tx-byte,rx-byte,tc-occupancy
description   : NA
target        : /var/run/cumulus/hft
port          : swp9s0