设置 Prometheus
关于设置 Prometheus
实施 Prometheus 堆栈可能很复杂,但可以通过利用 Helm 包管理器以及 Prometheus Operator 和 kube-prometheus 项目来管理。Operator 为 Prometheus 和 Grafana 使用标准配置和仪表板,而 Helm prometheus-operator chart 允许您通过安装 Prometheus Operator 和上面列出的其余组件来启动并运行完整的集群监控解决方案。
首先,添加 helm 仓库
$ helm repo add prometheus-community \
   https://prometheus-community.github.io/helm-charts
现在,搜索可用的 prometheus chart
$ helm search repo kube-prometheus
在您找到要使用的 chart 版本后,检查该 chart,以便我们可以修改设置
$ helm inspect values prometheus-community/kube-prometheus-stack > /tmp/kube-prometheus-stack.values
接下来,编辑 values 文件以更改 Prometheus 服务器服务可用的端口。在 chart 的 prometheus 实例部分中,将服务类型从 ClusterIP 更改为 NodePort。这将允许 Prometheus 服务器在您的机器 IP 地址的 30090 端口上可访问,如 http://<machine-ip>:30090/
From:
 ## Port to expose on each node
 ## Only used if service.type is 'NodePort'
 ##
 nodePort: 30090

 ## Loadbalancer IP
 ## Only use if service.type is "loadbalancer"
 loadBalancerIP: ""
 loadBalancerSourceRanges: []
 ## Service type
 ##
 type: ClusterIP

To:
 ## Port to expose on each node
 ## Only used if service.type is 'NodePort'
 ##
 nodePort: 30090

 ## Loadbalancer IP
 ## Only use if service.type is "loadbalancer"
 loadBalancerIP: ""
 loadBalancerSourceRanges: []
 ## Service type
 ##
 type: NodePort
此外,将 prometheusSpec.serviceMonitorSelectorNilUsesHelmValues 设置修改为下面的 false
## If true, a nil or {} value for prometheus.prometheusSpec.serviceMonitorSelector will cause the
## prometheus resource to be created with selectors based on values in the helm deployment,
## which will also match the servicemonitors created
##
serviceMonitorSelectorNilUsesHelmValues: false
将以下 configMap 添加到 Helm chart 中关于 additionalScrapeConfigs 的部分。
## AdditionalScrapeConfigs allows specifying additional Prometheus scrape configurations. Scrape configurations
## are appended to the configurations generated by the Prometheus Operator. Job configurations must have the form
## as specified in the official Prometheus documentation:
## https://prometheus.ac.cn/docs/prometheus/latest/configuration/configuration/#scrape_config. As scrape configs are
## appended, the user is responsible to make sure it is valid. Note that using this feature may expose the possibility
## to break upgrades of Prometheus. It is advised to review Prometheus release notes to ensure that no incompatible
## scrape configs are going to break Prometheus after the upgrade.
##
## The scrape configuration example below will find master nodes, provided they have the name .*mst.*, relabel the
## port to 2379 and allow etcd scraping provided it is running on all Kubernetes master nodes
##
additionalScrapeConfigs:
- job_name: gpu-metrics
  scrape_interval: 1s
  metrics_path: /metrics
  scheme: http
  kubernetes_sd_configs:
  - role: endpoints
    namespaces:
      names:
      - gpu-operator
  relabel_configs:
  - source_labels: [__meta_kubernetes_endpoints_name]
    action: drop
    regex: .*-node-feature-discovery-master
  - source_labels: [__meta_kubernetes_pod_node_name]
    action: replace
    target_label: kubernetes_node
最后,通过 Helm 使用 kube-prometheus-stack 部署 Prometheus 和 Grafana Pod
$ helm install prometheus-community/kube-prometheus-stack \
   --create-namespace --namespace prometheus \
   --generate-name \
   --values /tmp/kube-prometheus-stack.values
注意
您还可以在 Helm 命令行中直接覆盖 Prometheus chart 中的值
$ helm install prometheus-community/kube-prometheus-stack \
   --create-namespace --namespace prometheus \
   --generate-name \
   --set prometheus.service.type=NodePort \
   --set prometheus.prometheusSpec.serviceMonitorSelectorNilUsesHelmValues=false
您应该看到如下所示的控制台输出
NAME: kube-prometheus-stack-1637791640
LAST DEPLOYED: Wed Nov 24 22:07:22 2021
NAMESPACE: prometheus
STATUS: deployed
REVISION: 1
NOTES:
kube-prometheus-stack has been installed. Check its status by running:
  kubectl --namespace prometheus get pods -l "release=kube-prometheus-stack-1637791640"

Visit https://github.com/prometheus-operator/kube-prometheus for instructions on how to create & configure Alertmanager and Prometheus instances using the Operator.
现在您可以看到 Prometheus 和 Grafana Pod
$ kubectl get pods -A
NAMESPACE     NAME                                                              READY   STATUS      RESTARTS   AGE
kube-system   calico-kube-controllers-8f59968d4-g28x8                           1/1     Running     1          23m
kube-system   calico-node-zfnfk                                                 1/1     Running     1          23m
kube-system   coredns-f9fd979d6-p7djj                                           1/1     Running     1          23m
kube-system   coredns-f9fd979d6-qhhgq                                           1/1     Running     1          23m
kube-system   etcd-ip-172-31-92-253                                             1/1     Running     1          23m
kube-system   kube-apiserver-ip-172-31-92-253                                   1/1     Running     2          23m
kube-system   kube-controller-manager-ip-172-31-92-253                          1/1     Running     1          23m
kube-system   kube-proxy-mh528                                                  1/1     Running     1          23m
kube-system   kube-scheduler-ip-172-31-92-253                                   1/1     Running     1          23m
kube-system   nvidia-device-plugin-1603211071-7hlk6                             1/1     Running     0          15m
prometheus    alertmanager-kube-prometheus-stack-1603-alertmanager-0            2/2     Running     0          13m
prometheus    kube-prometheus-stack-1603-operator-6b95bcdc79-wmbkn              2/2     Running     0          13m
prometheus    kube-prometheus-stack-1603211794-grafana-67ff56c449-tlmxc         2/2     Running     0          13m
prometheus    kube-prometheus-stack-1603211794-kube-state-metrics-877df67c49f   1/1     Running     0          13m
prometheus    kube-prometheus-stack-1603211794-prometheus-node-exporter-b5fl9   1/1     Running     0          13m
prometheus    prometheus-kube-prometheus-stack-1603-prometheus-0                3/3     Running     1          13m
设置 DCGM
现在,我们将部署 DCGM Exporter 以收集 GPU 遥测数据。首先,让我们设置 Helm 仓库
$ helm repo add gpu-helm-charts \
   https://nvda.org.cn/dcgm-exporter/helm-charts
然后更新 Helm 仓库
$ helm repo update
DCGM Exporter Helm Chart 定制
DCGM-Exporter helm 包包含针对各种用例的多个定制选项。
- arguments
自定义启动时传递给 dcgm-exporter 的命令行参数。
示例:将指标收集间隔设置为 1000 毫秒。
arguments["-c", "1000"]
- extraConfigMapVolumes
附加包含要监视的指标的 ConfigMap 卷。
示例:将 ‘exporter-metrics-config-map’ 卷附加到 Pod。
extraConfigMapVolumes:
- name: exporter-metrics-volume
  configMap:
    name: exporter-metrics-config-map
- extraEnv
自定义环境变量,包括且尤其包括 DCGM-Exporter 变量。
示例:收集 ConfigMap `exporter-metrics-volume` 中指定的指标。
extraEnv:
- name: DCGM_EXPORTER_CONFIGMAP_DATA
  value: "default:exporter-metrics-volume"
安装 DCGM Exporter chart
$ helm install \
   --generate-name \
   gpu-helm-charts/dcgm-exporter
现在,您可以观察 DCGM Exporter Pod
$ kubectl get pods -A
NAMESPACE     NAME                                                              READY   STATUS      RESTARTS   AGE
default       dcgm-exporter-2-1603213075-w27mx                                  1/1     Running     0          2m18s
kube-system   calico-kube-controllers-8f59968d4-g28x8                           1/1     Running     1          43m
kube-system   calico-node-zfnfk                                                 1/1     Running     1          43m
kube-system   coredns-f9fd979d6-p7djj                                           1/1     Running     1          43m
kube-system   coredns-f9fd979d6-qhhgq                                           1/1     Running     1          43m
kube-system   etcd-ip-172-31-92-253                                             1/1     Running     1          43m
kube-system   kube-apiserver-ip-172-31-92-253                                   1/1     Running     2          43m
kube-system   kube-controller-manager-ip-172-31-92-253                          1/1     Running     1          43m
kube-system   kube-proxy-mh528                                                  1/1     Running     1          43m
kube-system   kube-scheduler-ip-172-31-92-253                                   1/1     Running     1          43m
kube-system   nvidia-device-plugin-1603211071-7hlk6                             1/1     Running     0          35m
prometheus    alertmanager-kube-prometheus-stack-1603-alertmanager-0            2/2     Running     0          33m
prometheus    kube-prometheus-stack-1603-operator-6b95bcdc79-wmbkn              2/2     Running     0          33m
prometheus    kube-prometheus-stack-1603211794-grafana-67ff56c449-tlmxc         2/2     Running     0          33m
prometheus    kube-prometheus-stack-1603211794-kube-state-metrics-877df67c49f   1/1     Running     0          33m
prometheus    kube-prometheus-stack-1603211794-prometheus-node-exporter-b5fl9   1/1     Running     0          33m
prometheus    prometheus-kube-prometheus-stack-1603-prometheus-0                3/3     Running     1          33m
您可以查看作为 operator 和 DCGM Exporter 一部分设置的服务
$ kubectl get svc -A
NAMESPACE     NAME                                                        TYPE        CLUSTER-IP      EXTERNAL-IP   PORT(S)                        AGE
default       dcgm-exporter-2-1603213075                                  ClusterIP   10.104.40.255   <none>        9400/TCP                       7m44s
default       kubernetes                                                  ClusterIP   10.96.0.1       <none>        443/TCP                        49m
kube-system   kube-dns                                                    ClusterIP   10.96.0.10      <none>        53/UDP,53/TCP,9153/TCP         48m
kube-system   kube-prometheus-stack-1603-coredns                          ClusterIP   None            <none>        9153/TCP                       28m
kube-system   kube-prometheus-stack-1603-kube-controller-manager          ClusterIP   None            <none>        10252/TCP                      28m
kube-system   kube-prometheus-stack-1603-kube-etcd                        ClusterIP   None            <none>        2379/TCP                       28m
kube-system   kube-prometheus-stack-1603-kube-proxy                       ClusterIP   None            <none>        10249/TCP                      28m
kube-system   kube-prometheus-stack-1603-kube-scheduler                   ClusterIP   None            <none>        10251/TCP                      28m
kube-system   kube-prometheus-stack-1603-kubelet                          ClusterIP   None            <none>        10250/TCP,10255/TCP,4194/TCP   28m
prometheus    alertmanager-operated                                       ClusterIP   None            <none>        9093/TCP,9094/TCP,9094/UDP     28m
prometheus    kube-prometheus-stack-1603-alertmanager                     ClusterIP   10.100.20.237   <none>        9093/TCP                       28m
prometheus    kube-prometheus-stack-1603-operator                         ClusterIP   10.111.1.27     <none>        8080/TCP,443/TCP               28m
prometheus    kube-prometheus-stack-1603-prometheus                       NodePort    10.99.188.46    <none>        9090:30090/TCP                 28m
prometheus    kube-prometheus-stack-1603211794-grafana                    ClusterIP   10.109.219.60   <none>        80/TCP                         28m
prometheus    kube-prometheus-stack-1603211794-kube-state-metrics         ClusterIP   10.103.250.41   <none>        8080/TCP                       28m
prometheus    kube-prometheus-stack-1603211794-prometheus-node-exporter   ClusterIP   10.108.225.36   <none>        9100/TCP                       28m
prometheus    prometheus-operated                                         ClusterIP   None            <none>        9090/TCP                       28m
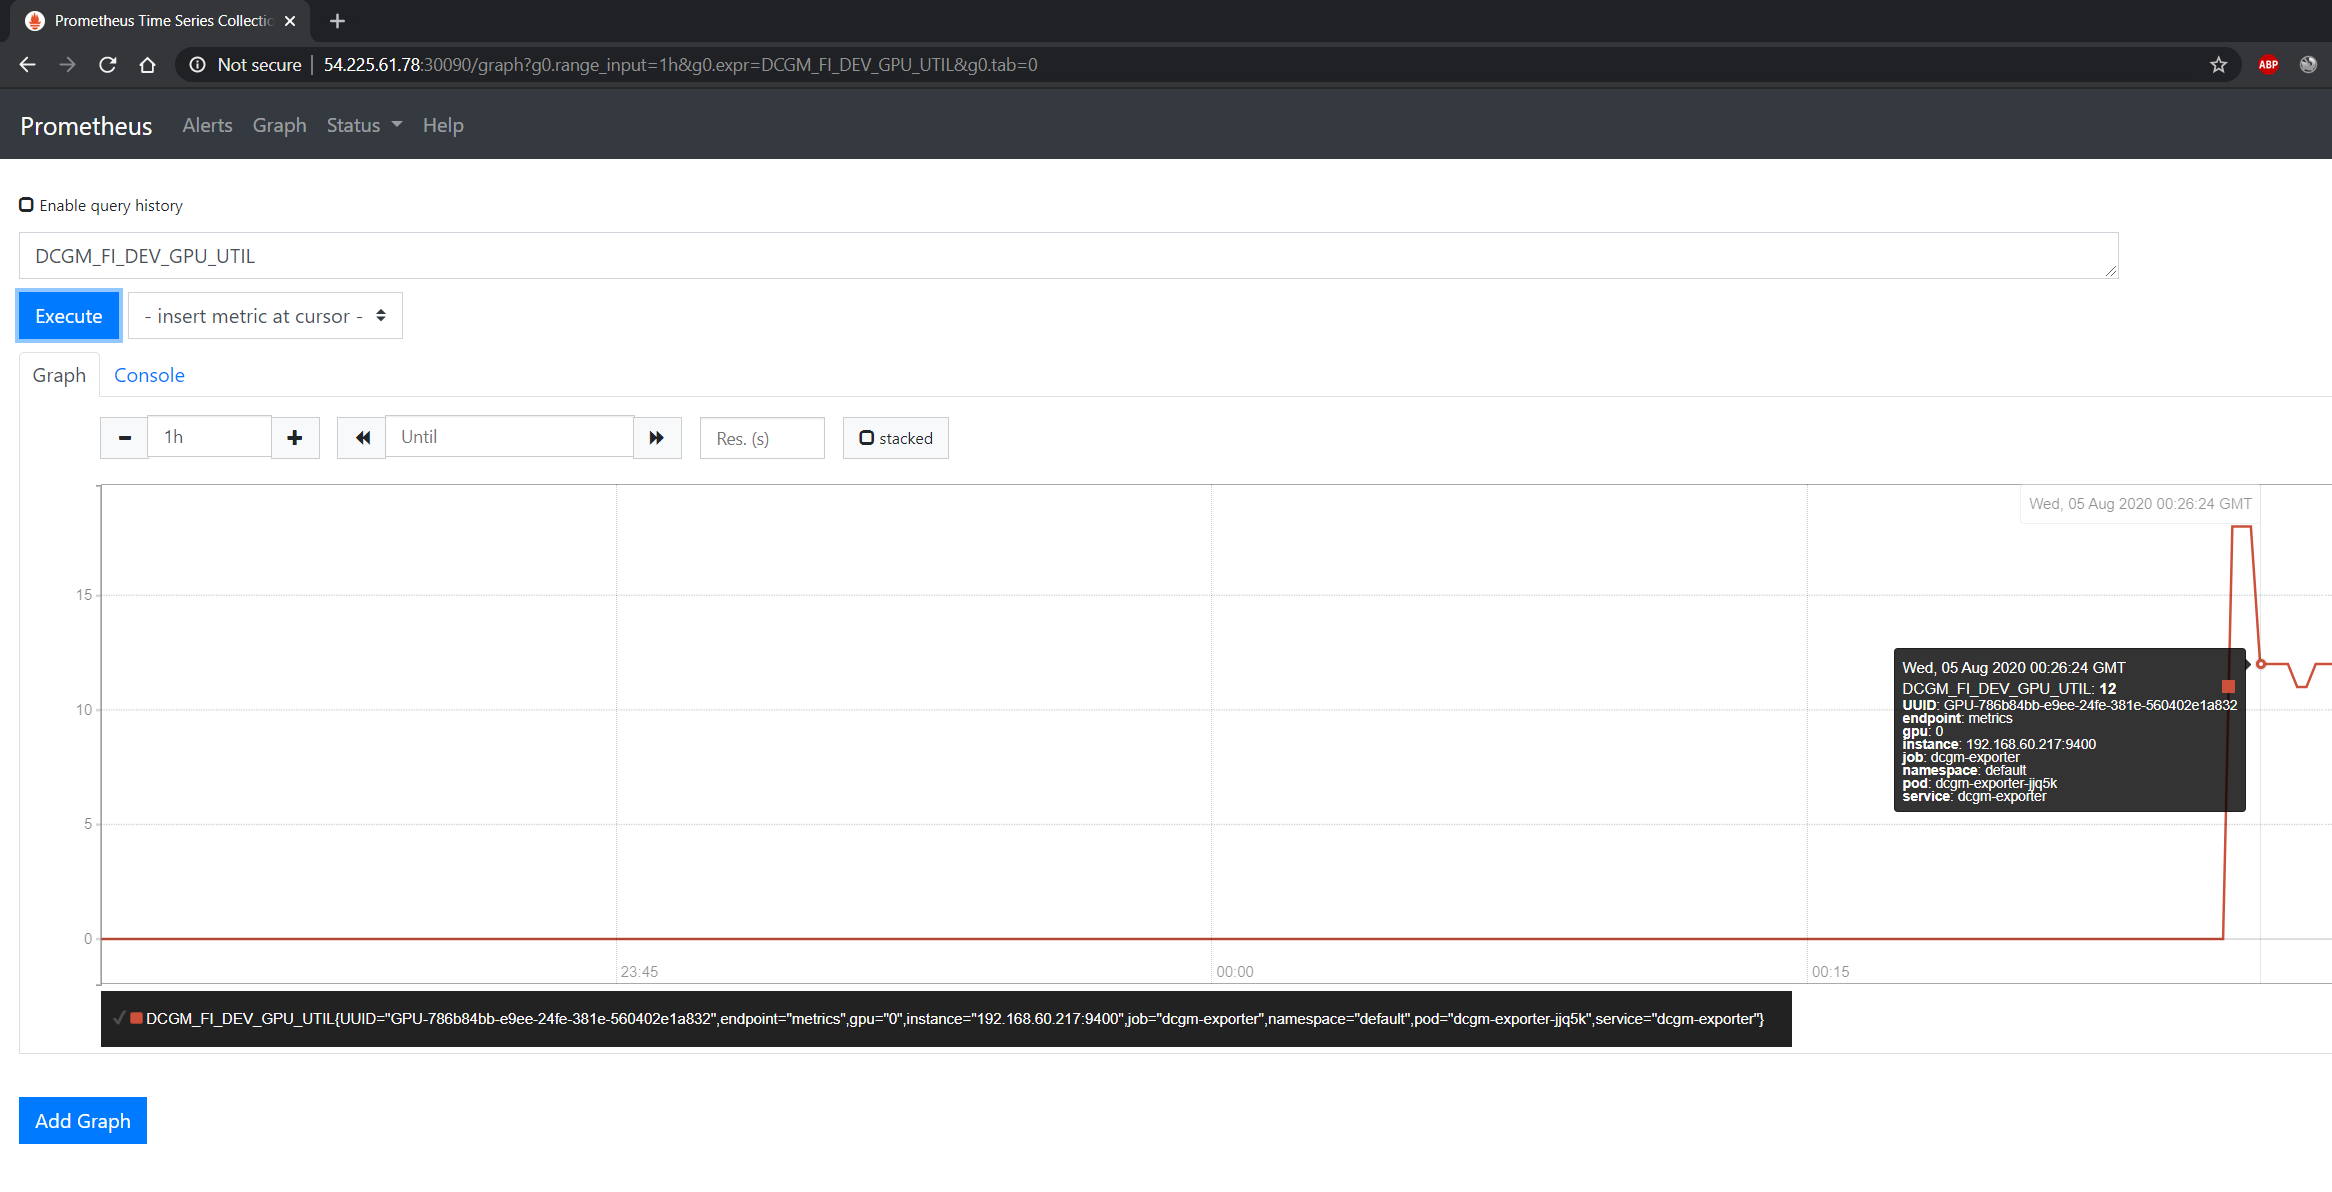
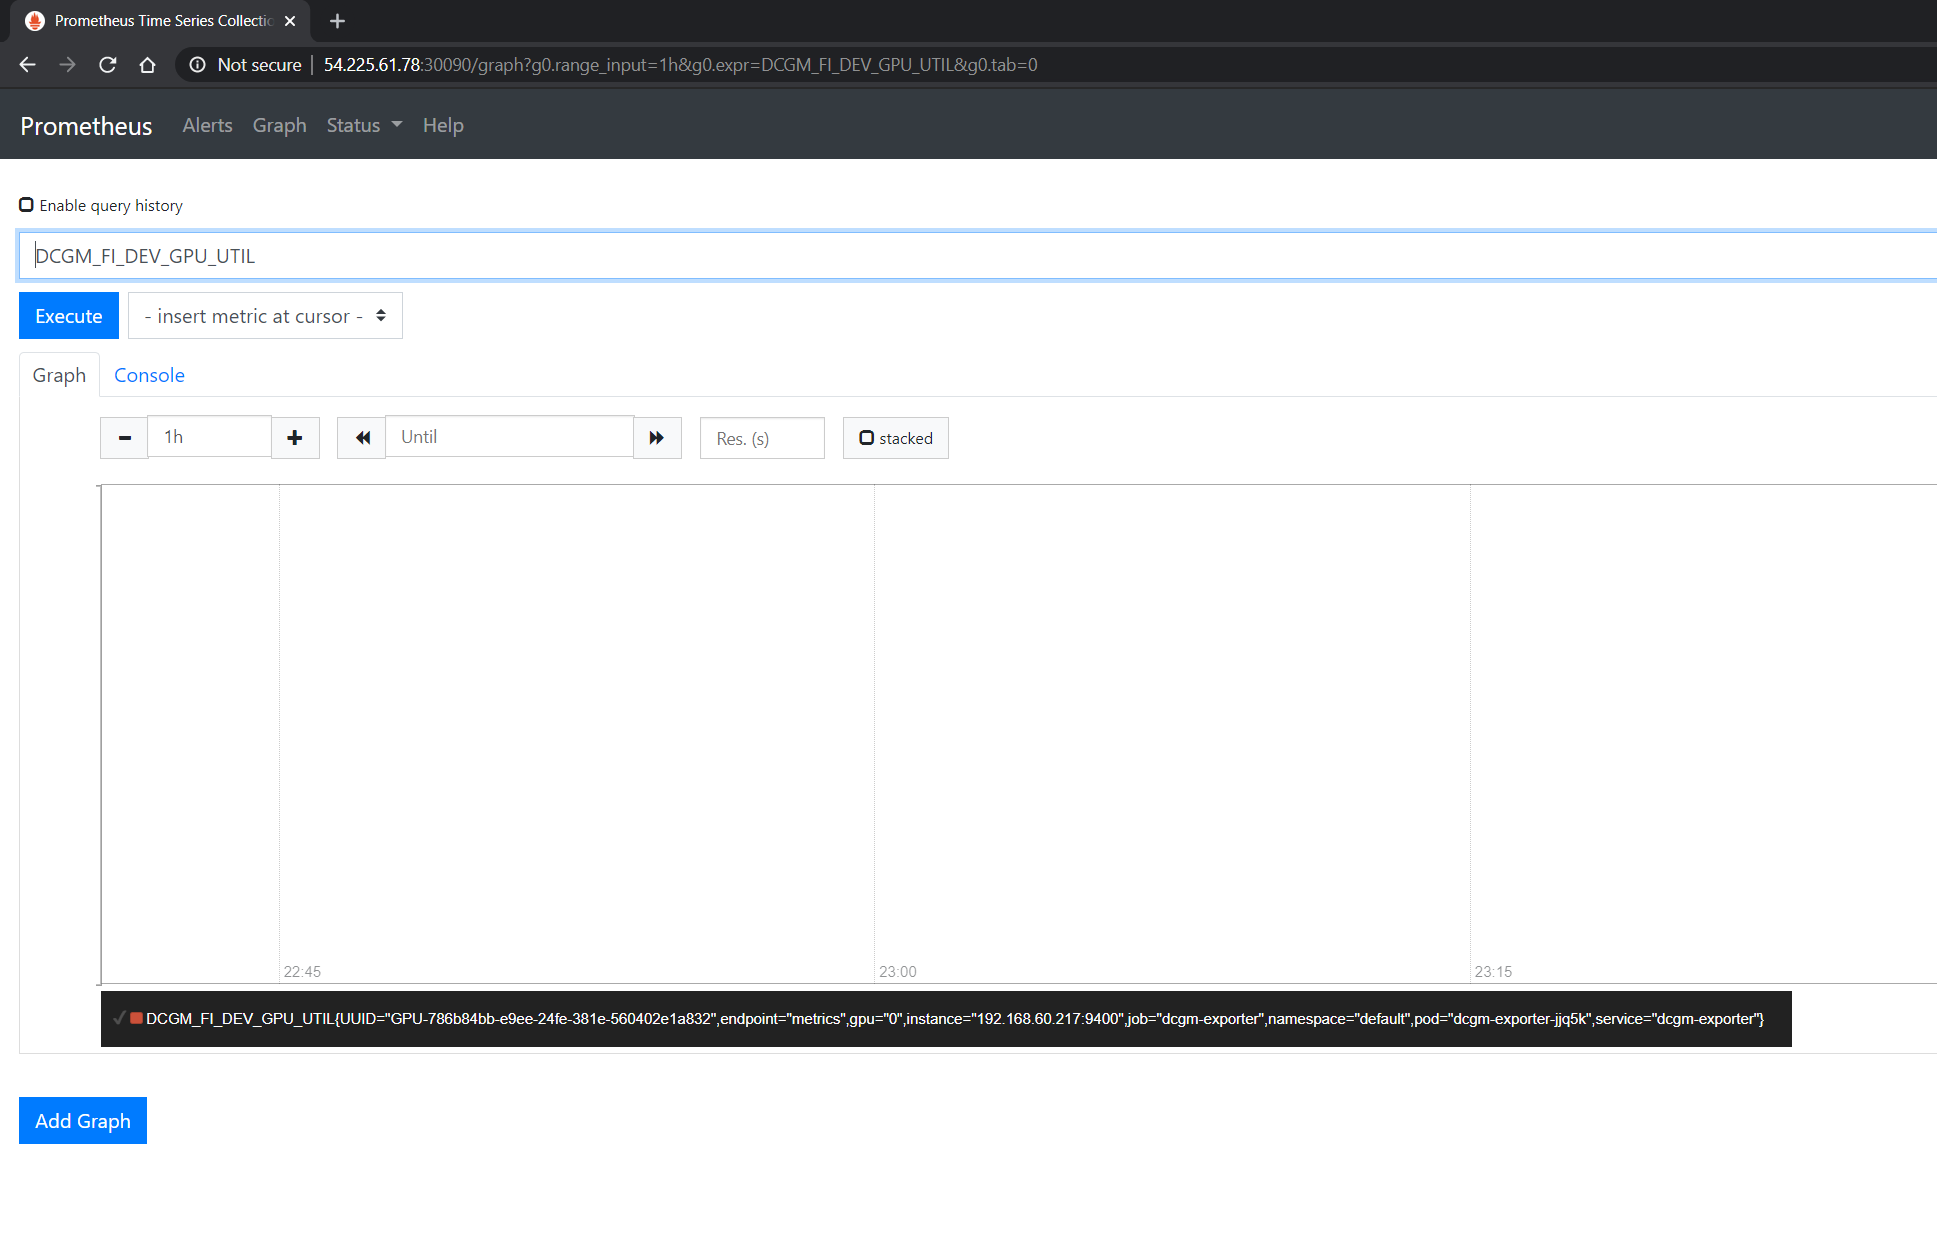
您可以观察到 Prometheus 服务器在节点的 IP 地址的 30090 端口上可用。打开您的浏览器访问 http://<machine-ip-address>:30090。DCGM 可能需要几分钟才能开始将指标发布到 Prometheus。可以通过在事件栏中键入 DCGM_FI_DEV_GPU_UTIL 来验证指标的可用性,以确定 GPU 指标是否可见
使用 Grafana
您还可以启动 Grafana 工具来可视化 GPU 指标。
有两种机制可以处理 Grafana 可用的端口 - 可以修补服务,也可以使用端口转发来访问主页。可以根据偏好选择任一选项。
修补 Grafana 服务
默认情况下,Grafana 使用 ClusterIP 来公开服务可访问的端口。可以将其更改为 NodePort,以便可以从浏览器访问页面,类似于 Prometheus 仪表板。
您可以使用 kubectl patch 来更新服务 API 对象,以公开 NodePort。
首先,修改 spec 以更改服务类型
$ cat << EOF | tee grafana-patch.yaml
spec:
  type: NodePort
  nodePort: 32322
EOF
现在使用 kubectl patch
$ kubectl patch svc kube-prometheus-stack-1603211794-grafana \
   -n prometheus \
   --patch "$(cat grafana-patch.yaml)"
service/kube-prometheus-stack-1603211794-grafana patched
您可以验证服务现在是否在外部可访问的端口上公开
$ kubectl get svc -A
NAMESPACE     NAME                                                        TYPE        CLUSTER-IP      EXTERNAL-IP   PORT(S)                        AGE
<snip>
prometheus    kube-prometheus-stack-1603211794-grafana                    NodePort    10.109.219.60   <none>        80:30759/TCP                   32m
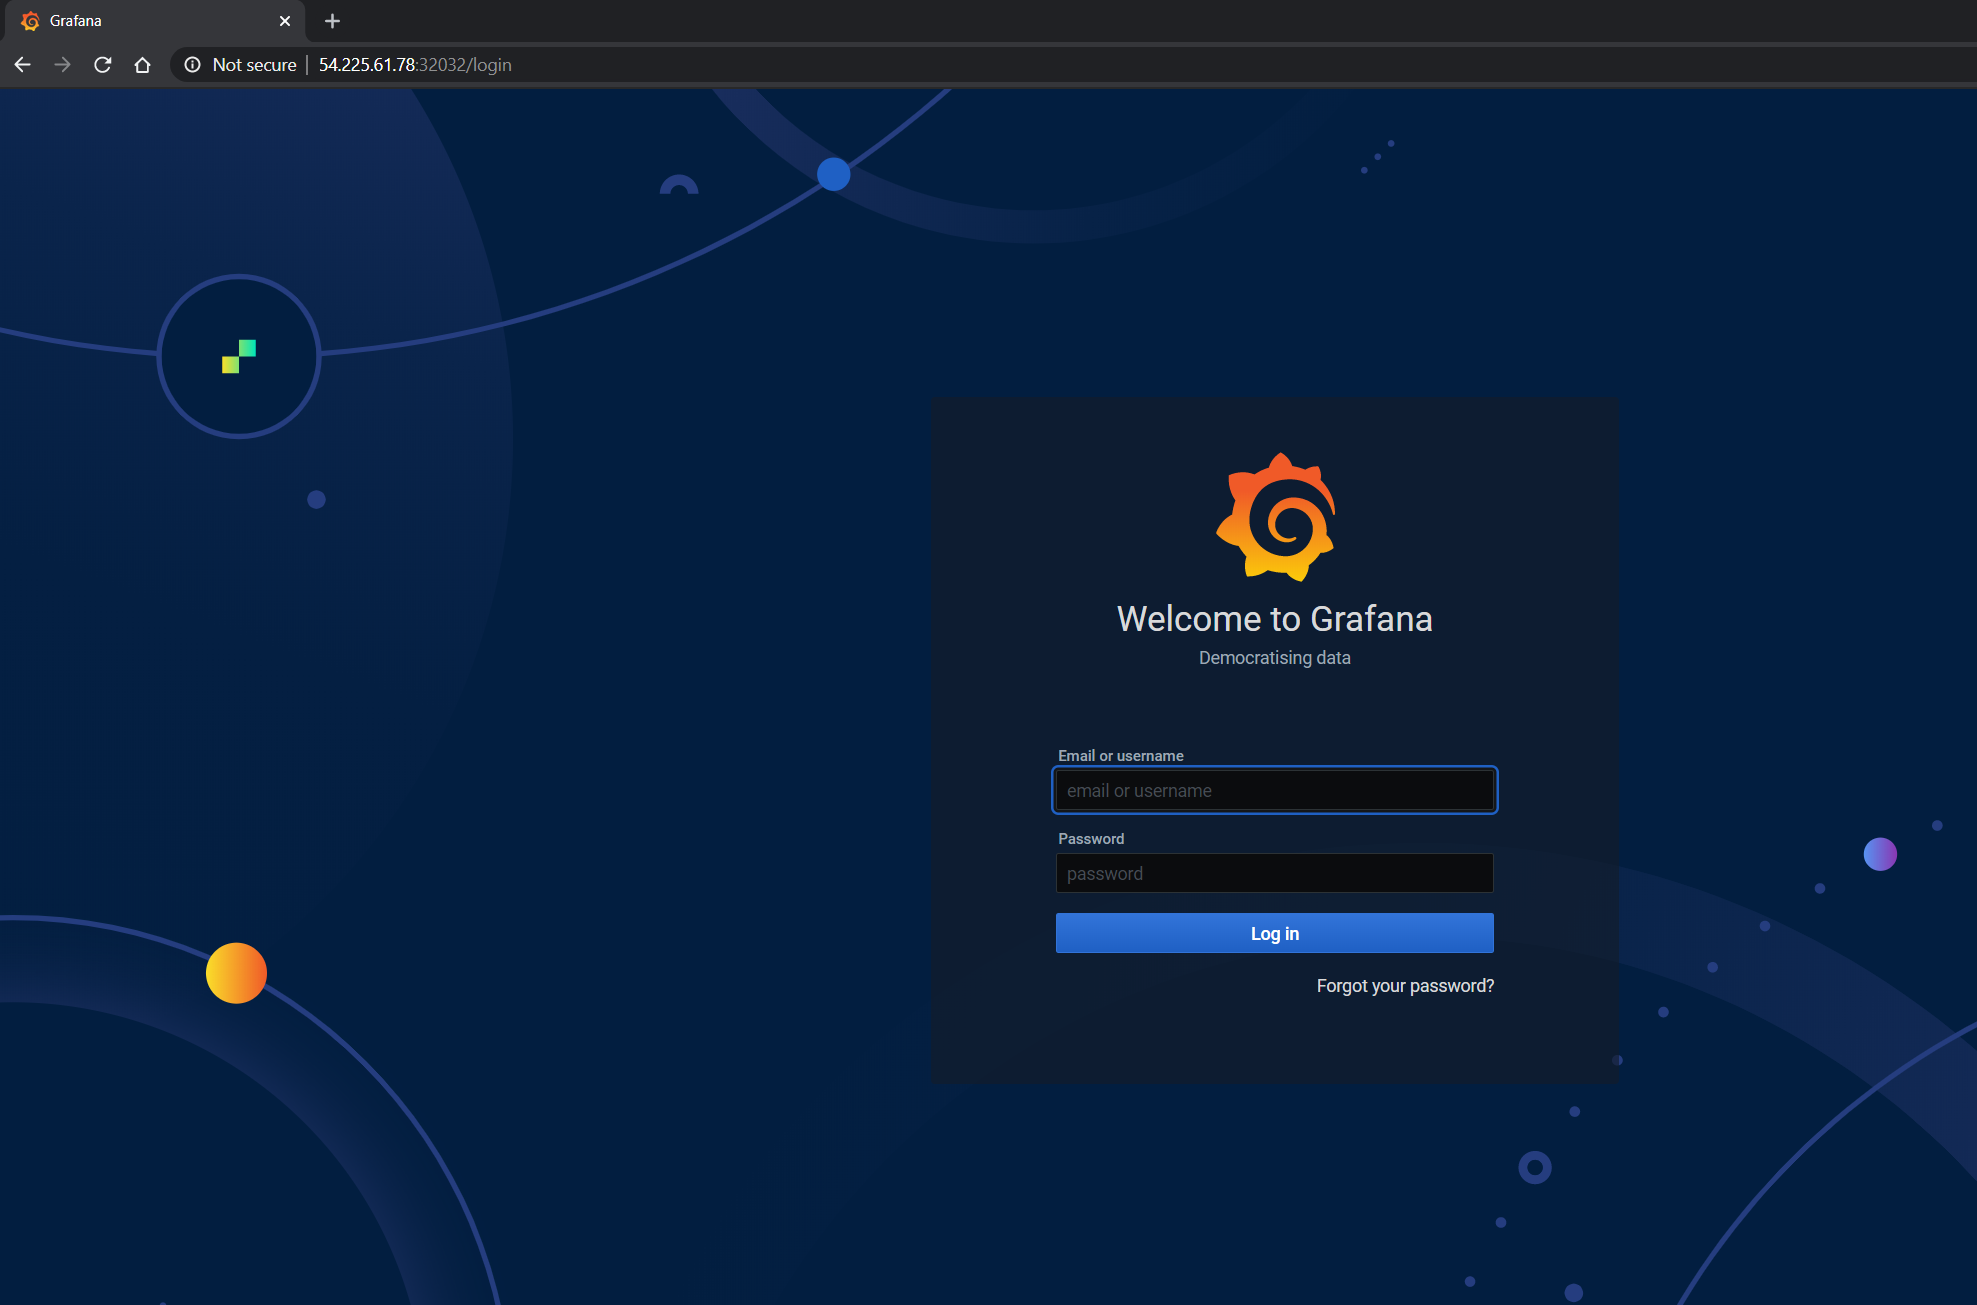
打开您的浏览器访问 http://<machine-ip-address>:30759 并查看 Grafana 登录页面。使用 admin 用户名访问 Grafana 主页。登录的密码凭据在我们在文档的较早部分编辑的 prometheus.values 文件中可用
## Deploy default dashboards.
##
defaultDashboardsEnabled: true

adminPassword: prom-operator
端口转发
访问 Grafana 页面的另一种方法是使用端口转发。
首先,可以观察到 Grafana 服务在端口 80 上可用。我们将需要从任意端口转发服务 - 在此示例中,我们将从本地计算机上的端口 32322 转发到服务上的端口 80(这又将转发到 Grafana Pod 正在侦听的端口 3000,如下所示)
$ kubectl port-forward svc/kube-prometheus-stack-1603211794-grafana -n prometheus 32322:80
Forwarding from 127.0.0.1:32322 -> 3000
Forwarding from [::1]:32322 -> 3000
Handling connection for 32322
如果您的集群是在云实例(例如 AWS EC2)上设置的,您可能必须在本地工作站和实例之间设置 SSH 隧道,使用端口转发在本地工作站的浏览器中查看 Grafana 工具。例如,在 Windows 上,您可以使用 PuTTY 打开 SSH 隧道,并在 SSH 菜单中的 Tunnels 子菜单下将源端口指定为 32322,目标指定为 localhost:32322。
打开您的浏览器并指向 https://:32322/ 以使用上一节中相同的凭据查看 Grafana 登录页面。
Grafana 中的 DCGM 仪表板
要为 DCGM 添加仪表板,您可以使用 NVIDIA 提供的标准仪表板,该仪表板也可以自定义。
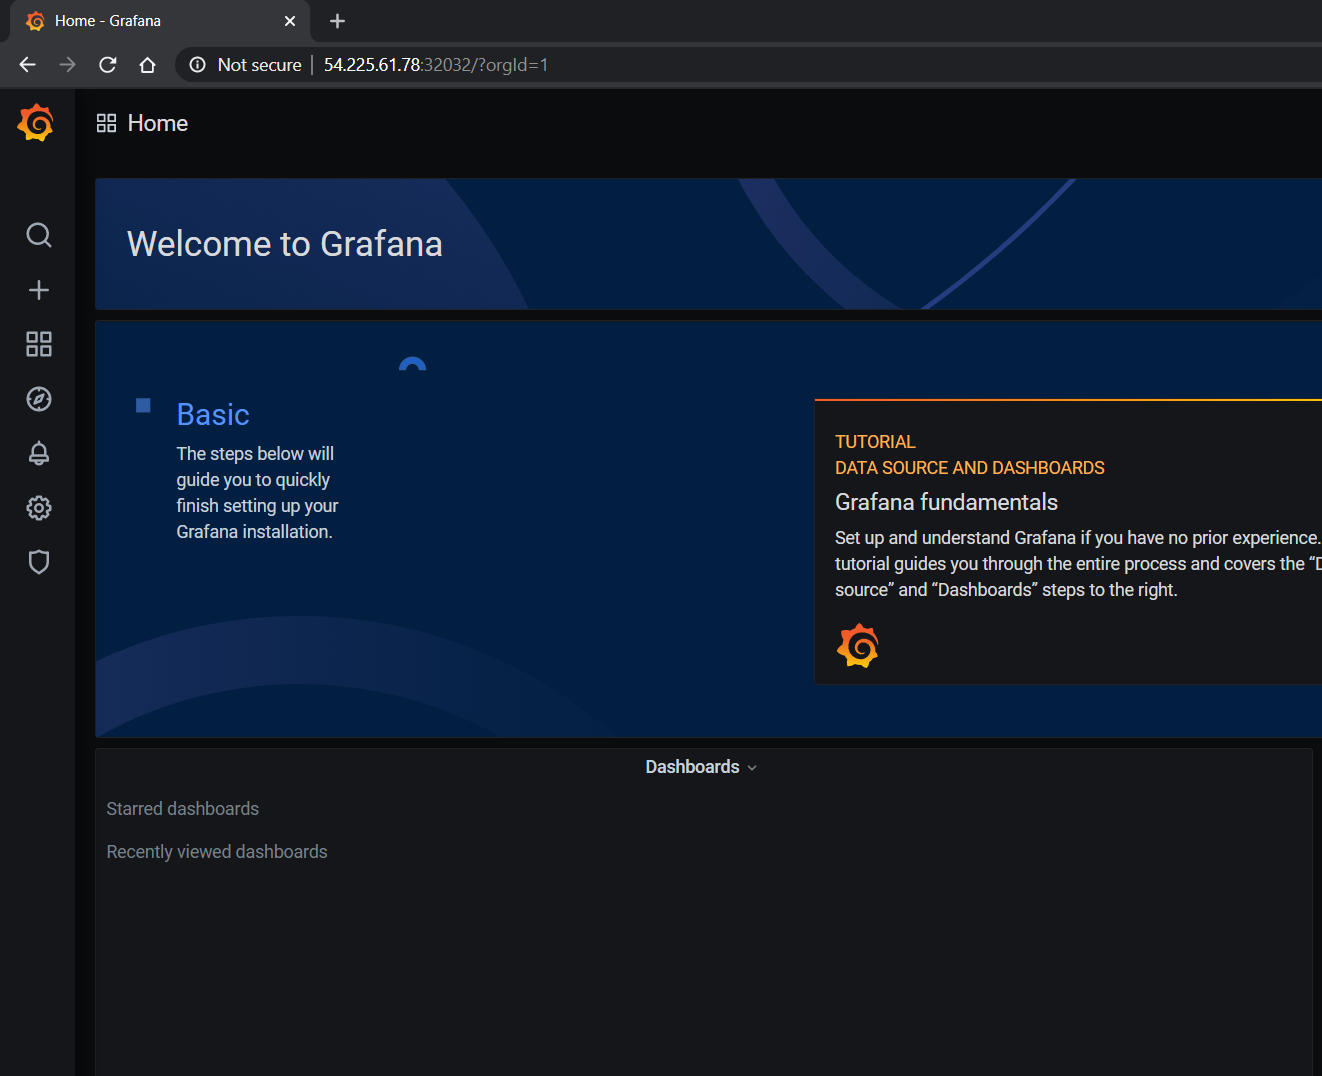
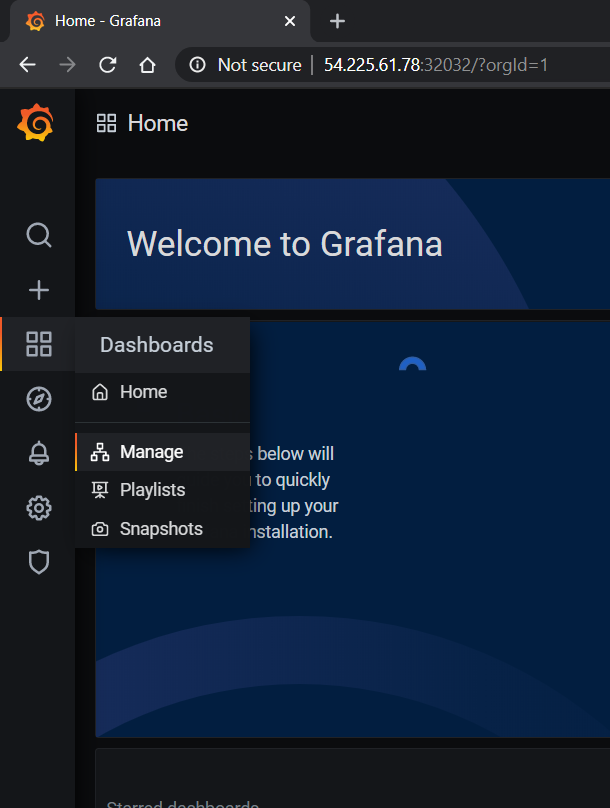
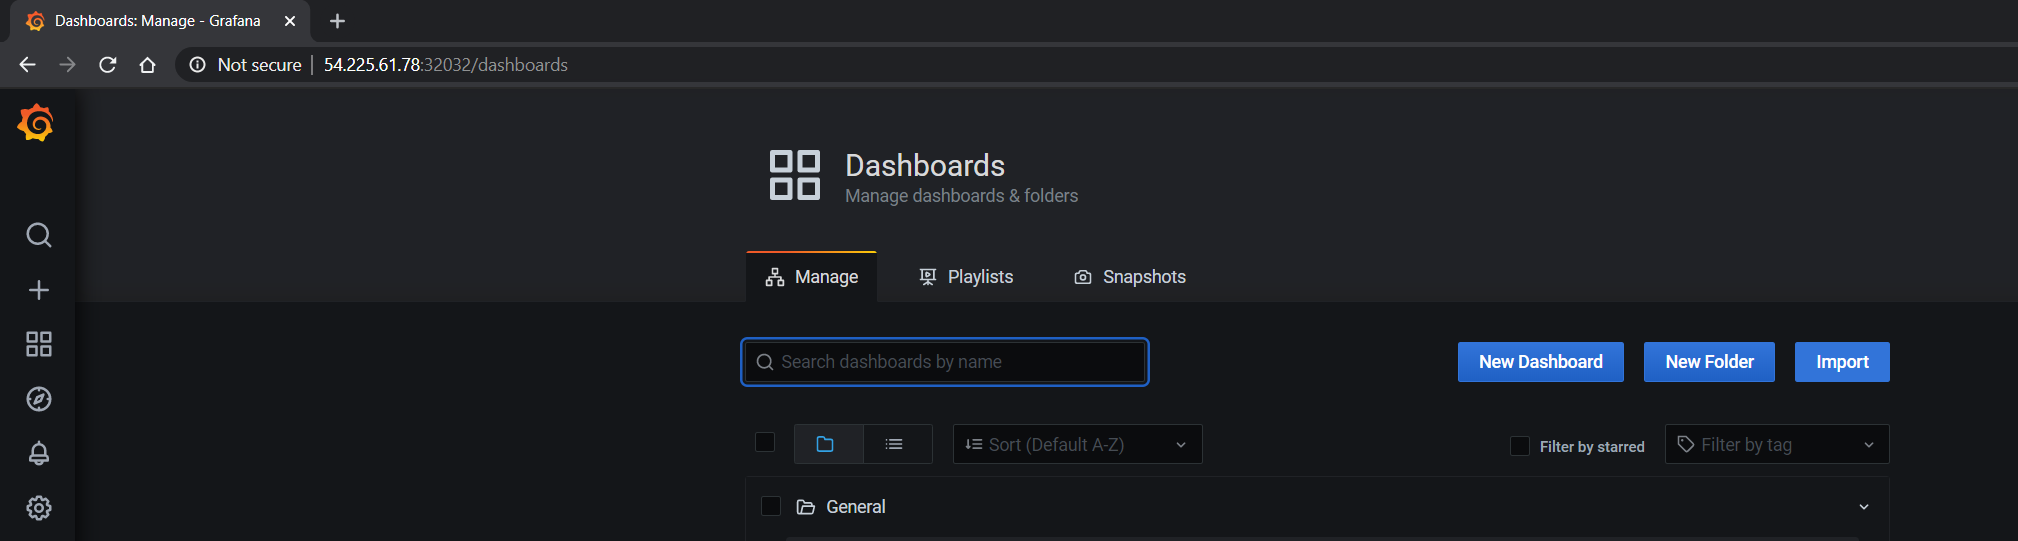
要访问仪表板,请从 Grafana 主页导航到 Dashboards -> Manage -> Import
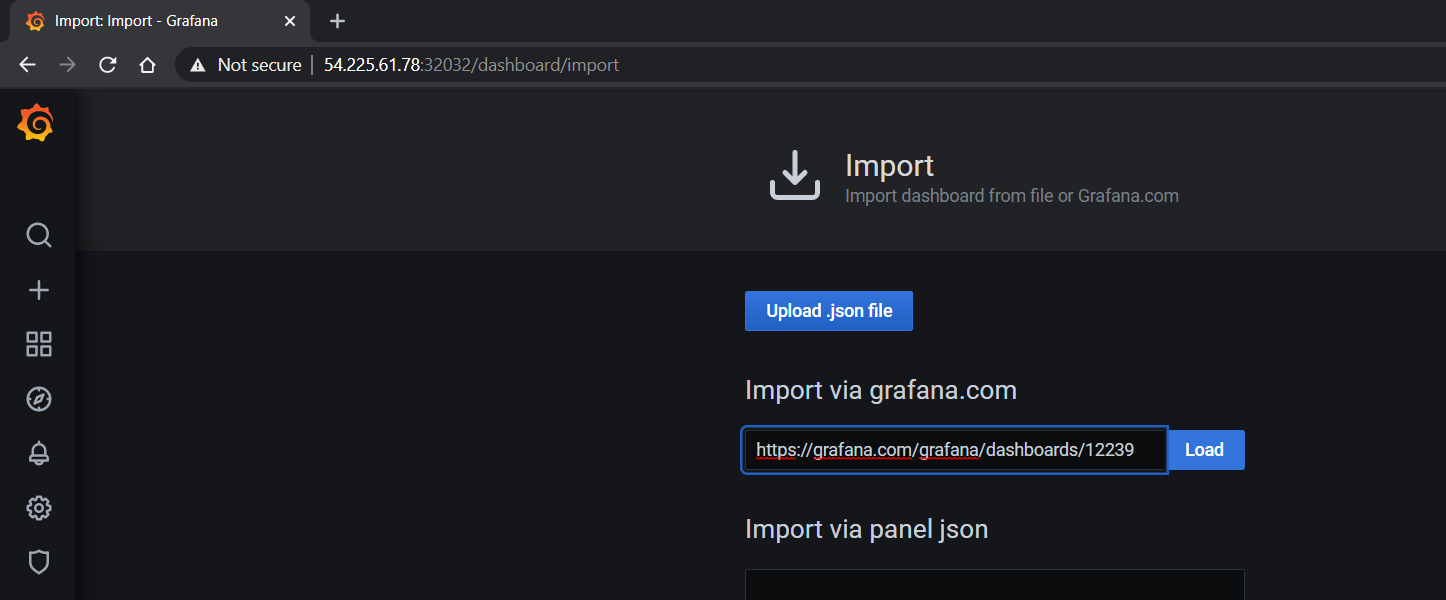
从 https://grafana.org.cn/grafana/dashboards/12239 导入 NVIDIA 仪表板,并在下拉列表中选择 Prometheus 作为数据源
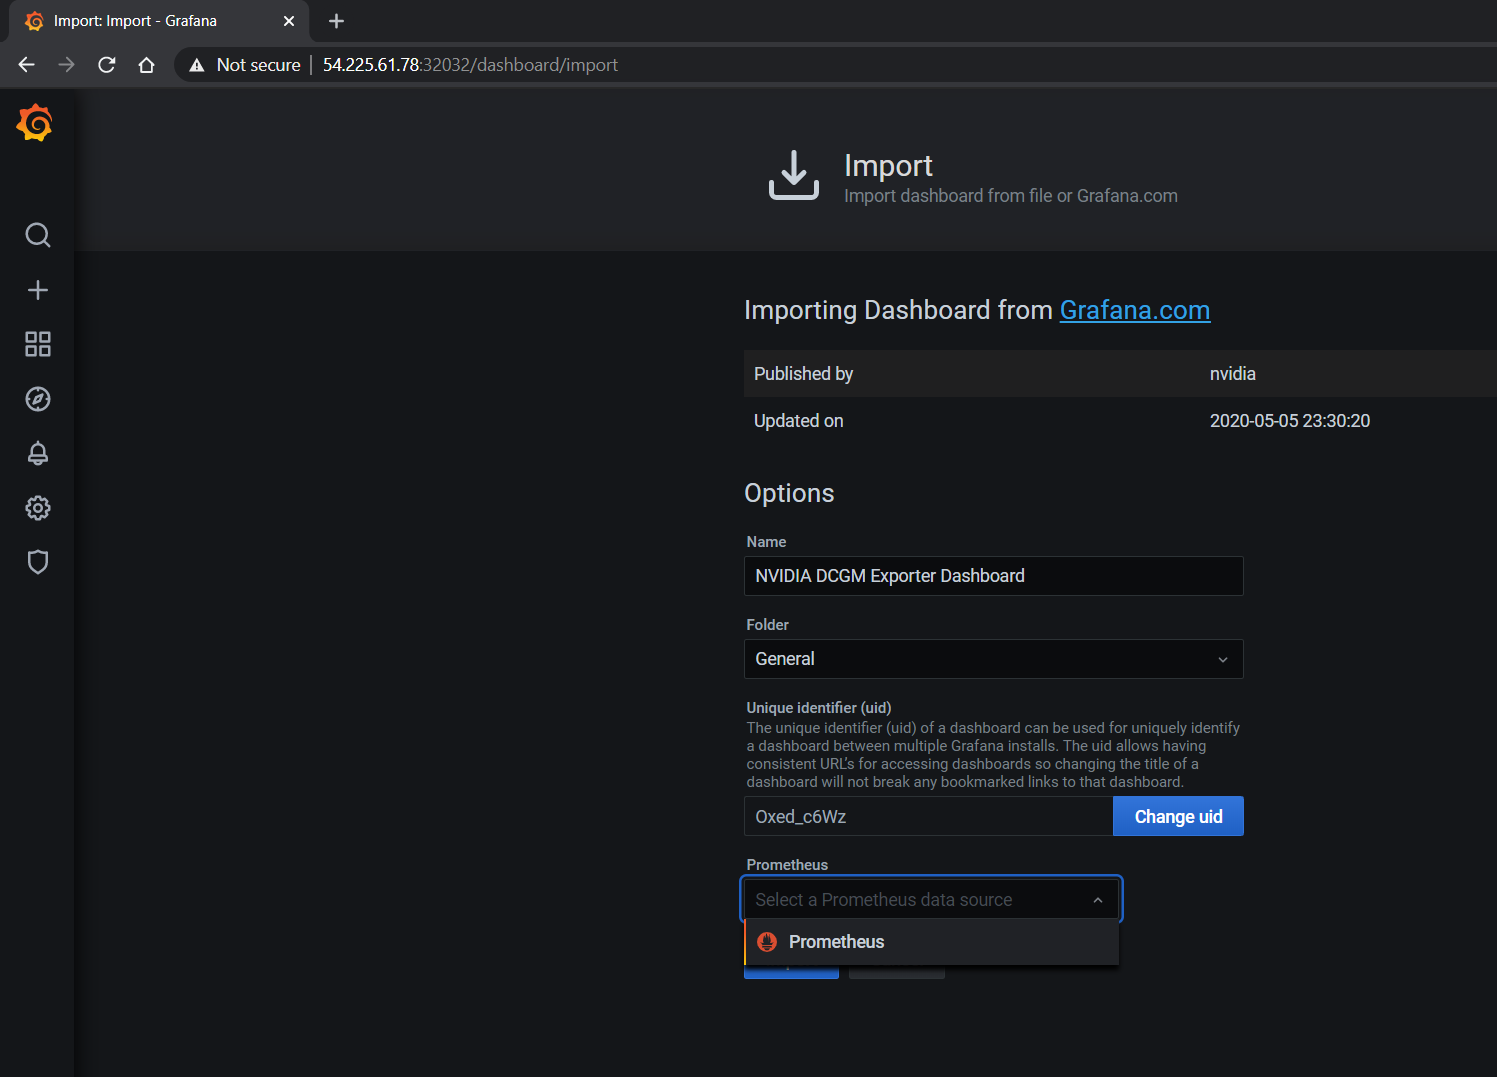
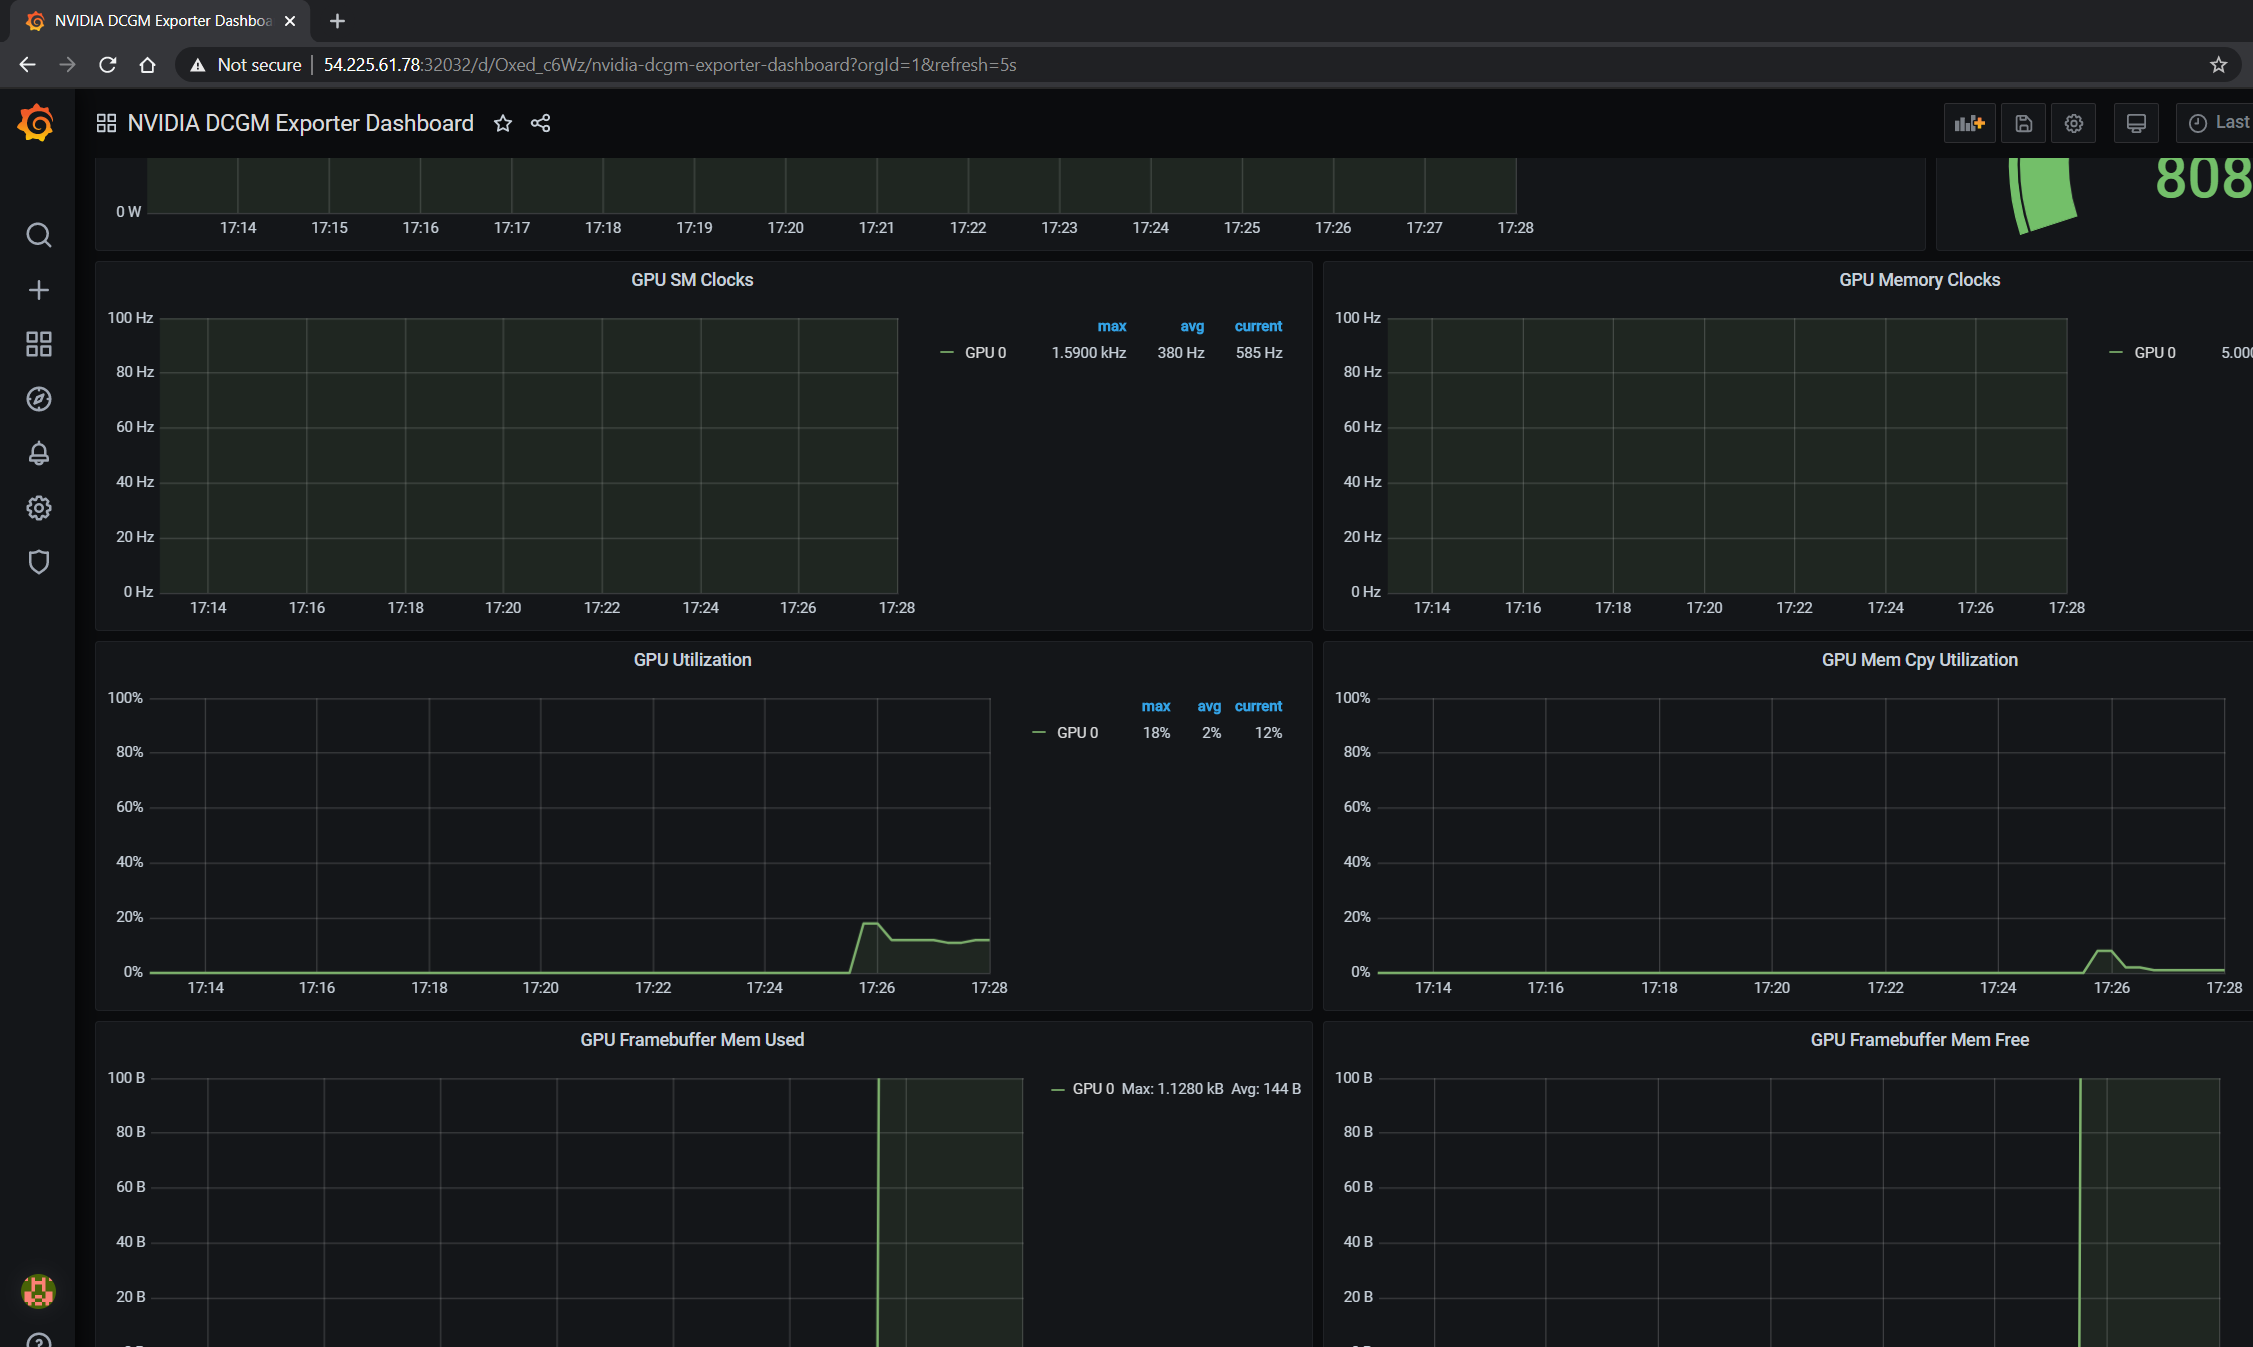
GPU 仪表板现在将在 Grafana 上可用,用于可视化指标
查看运行应用程序的指标
在本节中,让我们运行一个更复杂的应用程序,并在 NVIDIA 仪表板上查看 GPU 指标。
我们可以使用 NGC 注册表上提供的标准 DeepStream Intelligent Video Analytics Demo。对于我们的示例,让我们使用 Helm chart 来使用 WebUI
$ helm fetch https://helm.ngc.nvidia.com/nvidia/charts/video-analytics-demo-0.1.4.tgz && \
   helm install video-analytics-demo-0.1.4.tgz --generate-name
NAME: video-analytics-demo-0-1596587131
LAST DEPLOYED: Wed Aug  5 00:25:31 2020
NAMESPACE: default
STATUS: deployed
REVISION: 1
NOTES:
1. Get the RTSP URL by running these commands:
export NODE_PORT=$(kubectl get --namespace default -o jsonpath="{.spec.ports[0].nodePort}" services video-analytics-demo-0-1596587131)
export NODE_IP=$(kubectl get nodes --namespace default -o jsonpath="{.items[0].status.addresses[0].address}")
echo rtsp://$NODE_IP:$NODE_PORT/ds-test

2.Get the WebUI URL by running these commands:
export ANT_NODE_PORT=$(kubectl get --namespace default -o jsonpath="{.spec.ports[0].nodePort}" services video-analytics-demo-0-1596587131-webui)
export NODE_IP=$(kubectl get nodes --namespace default -o jsonpath="{.items[0].status.addresses[0].address}")
echo http://$NODE_IP:$ANT_NODE_PORT/WebRTCApp/play.html?name=videoanalytics
Disclaimer:
Note: Due to the output from DeepStream being real-time via RTSP, you may experience occasional hiccups in the video stream depending on network conditions.
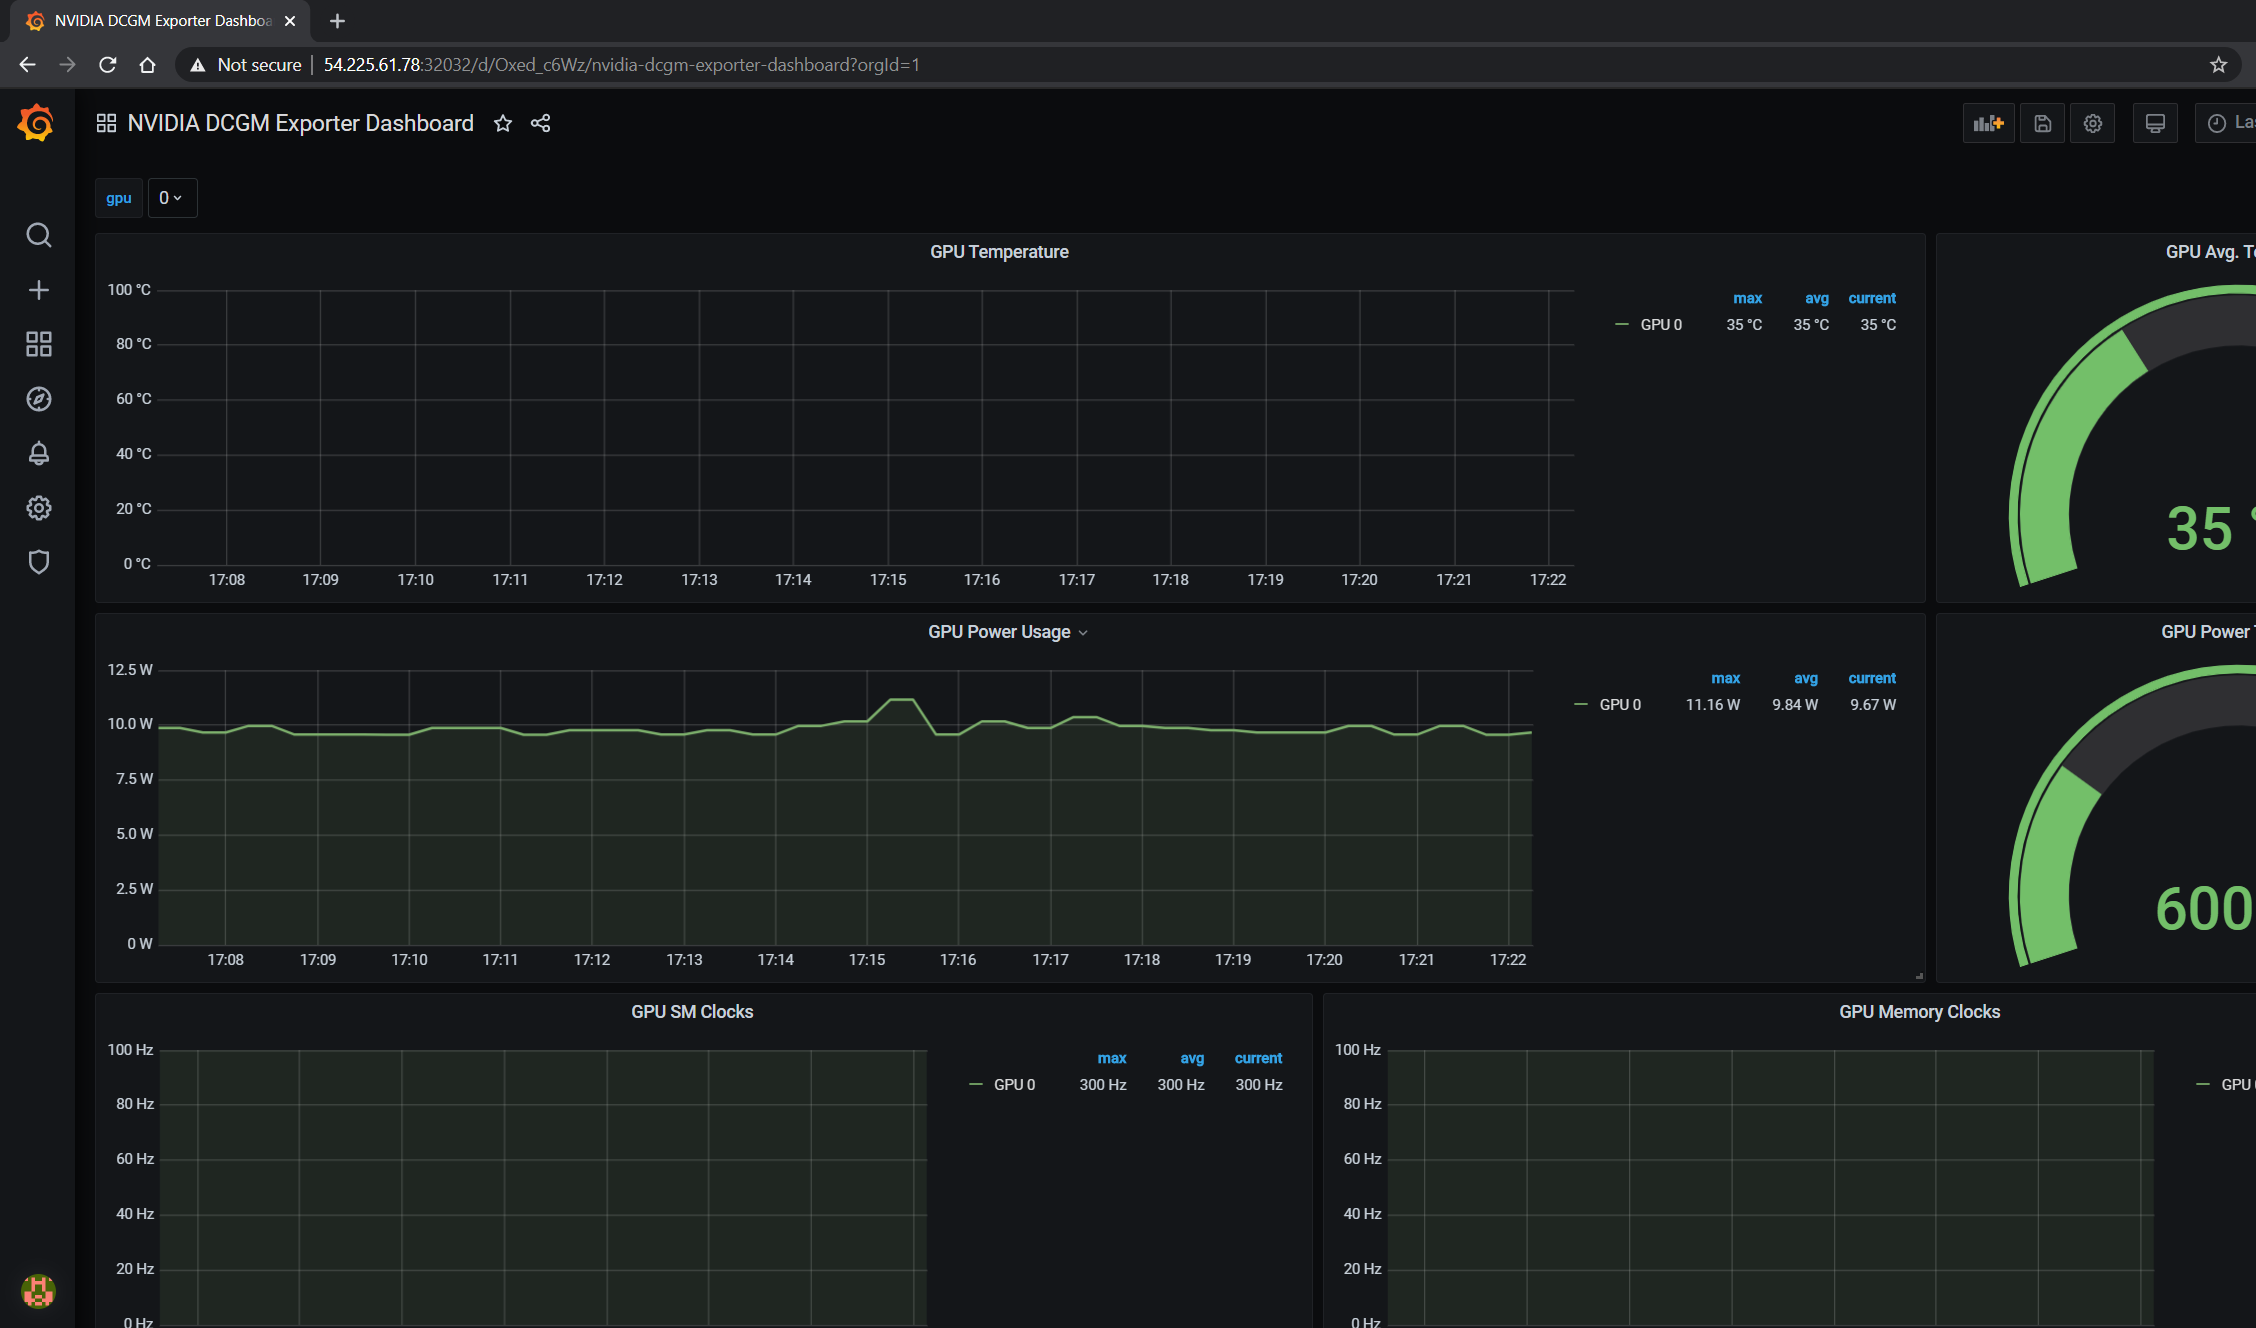
可以通过指向上述说明之后的地址在浏览器中查看演示。
GPU 指标在 Grafana 仪表板或 Prometheus 仪表板中也可见,如下面的屏幕截图所示,显示了 GPU 利用率、在 GPU 上运行应用程序时分配的内存